Introduction
WACOSS considers the minimum wage to be a vital means of protecting low-income workers from poverty, which also delivers economic benefits to the wider Western Australian community. An adequate and appropriate minimum wage level supports a decent standard of living for working people and their families. It ensures a fair and inclusive economy that enables us all to thrive. As the peak body for the community service sector in WA, and as an advocate for people experiencing marginalisation, disadvantage and hardship, WACOSS has a particular interest in the adequacy of living standards and quality of life experienced by Western Australians living on low incomes.
WACOSS’s submission to the 2022 State Wage Case relies on the provisions in the Industrial Relations Act 1979, at Clause 50A(3)(a) for the Commission to consider in its determination of minimum rates of pay the need to:
- ensure that Western Australians have a system of fair wages and conditions of employment; and
- meet the needs of the low paid; and
- provide fair wage standards in the context of living standards generally prevailing in the community; and
- contribute to improved living standards for employees; and
- protect employees who may be unable to reach an industrial agreement; and
- encourage ongoing skills development; and
- provide equal remuneration for men and women for work of equal or comparable value.[1]
In preparing this submission, WACOSS has carefully considered the changing economic and workplace environment for low-wage workers, and the health of the wider economy. We have reviewed the state of knowledge in related areas and considered the latest research and analysis to ensure our submission is up to date and directly relevant to the lived experience of minimum wage workers in WA. We do so in order to provide the Commission with the best available data and analysis upon which to base its deliberations.
WACOSS’s Claim
WACOSS submits that an increase to the State Minimum Wage rate of 7.6 per cent is essential to meet the needs of the low paid and to contribute to improved living standards for employees.
Western Australia’s state economy is in a globally enviable position, but the benefits of this strong economy are not shared equally. The Premier and Treasurer, in his delivery of the 2022-2023 State Budget, outlined just how well the Western Australian economy is faring:
“Our domestic economy grew by 7.2 per cent over the two years of the pandemic, two and a half times the rate of growth of the rest of the nation.
Western Australia’s unemployment rate of 3.4 per cent is the lowest in the nation and our best result since 2008. More than 1.46 million Western Australians are now employed, which is more than any time in our history.”[2]
Despite the state’s wealth and record low unemployment levels, many in the community are facing significant hardship. Runaway rental costs and skyrocketing petrol prices are placing significant living cost pressures and increased financial stress on WA households, including low paid workers.
The weekly median rent for a unit accounts for nearly 53 per cent of the State Minimum Wage, while the median rent for a house is nearly 58 per cent. The more of their income that households must dedicate to covering housing costs, the less they will be able to spend on other essentials like food, energy and health – all of which have also increased in cost.
The latest CPI figures have made apparent the substantial price pressures with which WA households have been burdened, with an annual rise of 7.6 per cent recorded for Perth, compared to 5.1 per cent nationally.
The primary basis for WACOSS’s claim, as a result, is that our proposed increase to the State Minimum Wage is needed to meet the needs of the low paid and to contribute to improved living standards for employees.
Bankwest Curtin Economics Centre’s Behind the Line: Poverty and disadvantage in Australia 2022 report demonstrates that there is a significant share of people in Australia who are employed, but whose incomes keep them below the poverty line. [3] Using a 50 per cent of median incomes after housing costs poverty line indicated that nearly 20 per cent, or one in five, of people living in poverty are in work.
The Low Pay Report undertaken by WACOSS and UnionsWA (attached as an appendix to this submission) demonstrates that workers on low wages in Western Australia do not consider that their wages are increasing by the same proportion as their living costs, placing them in a state of financial stress or hardship. 66.3 per cent of respondents with an annual household income before tax that was lower than $52,000 reported that they had $100 or less a week after meeting their essential costs. 34.3 per cent reported that they had $50 or less a week after meeting their costs each week, which was the highest response for that income group.
Many workers told us that they had no emergency savings safety net, were accessing savings or superannuation funds to cope with financial hardship or are worried about not having enough to finance retirement. Just 6.9 per cent of respondents in the low-wage category indicated that they were currently coping well.
In conjunction with the substantial cost of living pressures being faced by low paid workers in Western Australia, WACOSS considers the state of the Western Australian economy to be such that a 7.6 per cent increase to the state’s minimum wage would be appropriate and affordable. Credit ratings agencies continue to identify Western Australia as a high performing economy,[4] while job growth is high, and our unemployment rate is low.[5]
With clear evidence of Western Australians experiencing significant living cost pressures, WACOSS considers a 7.6 per cent or $59.20 per week increase to the State Minimum Wage to be essential in order to meet the needs of the low paid and to contribute to improved living standards for employees.
The Cost of Living in WA
Consumer Price Index Changes
Western Australian households are experiencing significant and sustained price increases, eroding the purchasing power of their wages. The Consumer Price Index provides a key measure of price inflation for households, tracking price movements for a fixed basket of goods and services over time. The substantial price pressures that WA households have been burdened with were made apparent in the latest CPI figures released on 27 May 2022 which recorded an annual rise for Perth of 7.6 per cent and a quarterly rise of 3.3 per cent. This was the largest increase experienced by any of the capital cities.[6]
Perth, All groups CPI, quarterly and annual movements (%)
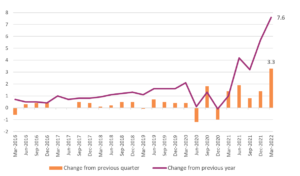
Source: ABS 6401.0
While national and local CPI rises represent significant highs, what is even more concerning is the rise in the cost of essential goods and services – which households have little or no capacity to avoid purchasing. Nationally, non-discretionary inflation increased by 6.6 per cent from the previous year and 3 per cent from the previous quarter, while discretionary inflation increased by 2.7 per cent from the previous year and 0.8 per cent from the previous quarter. As lower income households spend a greater proportion of their income on essential services, this non-discretionary inflation has a particularly significant impact on their capacity to meet their needs.
Australia, CPI, Non-discretionary and discretionary, quarterly and annual movement (%)
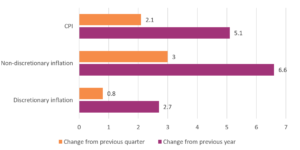
Source: ABS 6401.0
To better understand how this overall CPI increase for Perth is reflected in price rises for workers earning the minimum wage, we examine the CPI increases across some key non-discretionary categories, such as rent, food, and fuel below.
Perth, Rents CPI, quarterly and annual movements (%)
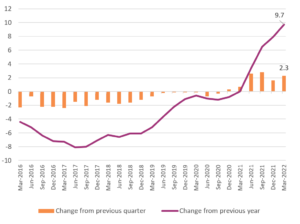
Source: ABS 6401.0
Rents in Perth increased on an annual basis by 9.7 per cent and from the previous quarter by 2.3 per cent, with Perth experiencing the second highest annual and quarterly change amongst the capital cities, after only Darwin. The increase on the same period in the previous year was the largest annual increase seen in the CPI for rents in Perth since 2009.
Perth, Food and non-alcoholic beverages CPI, quarterly and annual movements (%)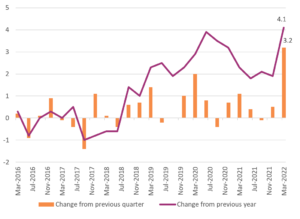
Source: ABS 6401.0
At 4.1 per cent, food and non-alcoholic beverages saw their largest annual percentage increase in 11 years, while the 3.2 per cent quarterly rise marked the largest percentage increase in Perth since June 2006. The annual rise in automotive fuel costs of 39.2 per cent is the largest annual rise recorded since September 1979.
Perth, Automotive Fuel CPI, quarterly and annual movements (%)
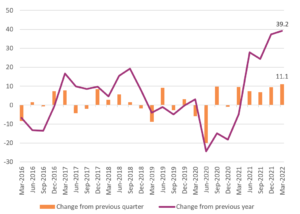
Source: ABS 6401.0
Price rises in automotive fuel have a disproportionate impact on low-income households, with the cost of housing pushing many to the outskirts of the urban fringe.[7] As these locations also have limited access to public transport infrastructure, jobs and services, a greater use of private vehicles is therefore necessary. Furthermore, those on lower incomes are more likely to have older and more inefficient cars that cost more to run.
Housing
Access to safe, secure and affordable shelter is essential for people to be able to fully engage in our community and participate in our economy. Stable tenancies are crucial to support positive outcomes in health and wellbeing, education and employment. Conversely, insecurity and instability in housing creates the circumstances for increased hardship and entrenched disadvantage.
Median rents in Perth have been increasing since the end of 2018, with rental costs drastically growing over 2020, 2021 and into 2022. On May 2, 2022, the Real Estate Institute of WA reported that median rents in Perth had reached their highest level ever recorded at $460 per week.[8]
Median Rent and Vacancy Rate
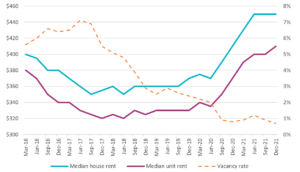
Source: REIWA data
The weekly median rent for a unit accounts for nearly 53 per cent of the State Minimum Wage, while the median rent for a house is nearly 58 per cent. Households are considered to be in “housing stress” when their housing costs exceed 30 per cent of their income, and their earnings are in the bottom 40 per cent of equivalised disposable income (which is the case for minimum wage earners).
If a household earning a minimum wage is paying over 53 per cent of their income on rent in a median rental property, then they most certainly qualify as being in severe housing stress.
The rapid growth in the share of the minimum wage consumed by median rental costs was slowed slightly by the increase awarded by the Commission in 2021, as can be seen in the graph below. However, further rises in rental costs mean that the median rent for a unit has returned to the same percentage of the State Minimum Wage that it represented in June 2021, while the median rent for a house now accounts for only slightly less than the June 2021 level.
Median Rent and the State Minimum Wage
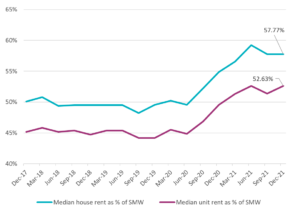
Source: Calculations based on REIWA and WA Department of Commerce data
Housing costs have a disproportionate impact on those living on the lowest incomes.[9] The annual Anglicare Rental Affordability Snapshot takes a ‘snapshot’ on a given day of the rental market and examines whether the properties being advertised are both affordable for a range of different low income types and whether those properties are appropriate for the composition of their household.[10]
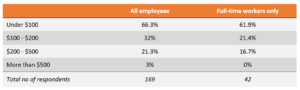
The 2022 Rental Affordability Snapshot was taken on 19 March 2022. The report found that only 42 properties, representing 1.4 per cent of properties advertised for rent in Perth were affordable and appropriate for a single worker on the minimum wage. In the South West and the Great Southern, 1.7 per cent of properties were affordable and appropriate, though that only equated to five actual properties. Only two properties or 1 per cent were affordable and appropriate for a single worker on the minimum wage in the North West.
Affordable and Appropriate Properties by Region and Household Type
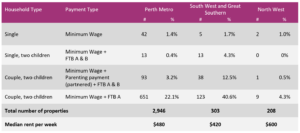
Source: Anglicare WA (2022) Rental Affordability Snapshot – Western Australia
The report found that since 2021 median rents have increased in the Perth Metro area by 12 per cent, in the South West and Great Southern by 13.5 per cent and in the North West by 9 per cent.
Over the last twelve months, Perth couples living on the minimum wage and in receipt of the Parenting Payment (meaning they are caring for a child under the age of 6) saw a sizeable drop in the affordability of rental properties, from 7.2 per cent to only 3.2 per cent of those advertised, as a result of escalating rental prices. A single parent on the minimum wage, supporting two children, saw a drop in affordability from 1.8 per cent to just 0.4 per cent.
Perth Metro – Affordability
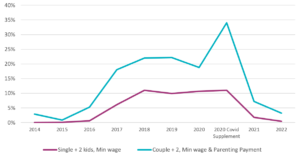
Source: Anglicare WA (2022) Rental Affordability Snapshot – Western Australia
Couples in the South West and Great Southern living on the minimum wage and in receipt of the Parenting Payment saw a drop in affordability from 24.9 per cent to 12.5 per cent. A single parent on the minimum wage, supporting two children, saw a drop in from 8.7 per cent to 4.3 per cent.
South West and Great Southern – Affordability
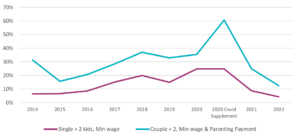
Source: Anglicare WA (2022) Rental Affordability Snapshot – Western Australia
In the North West, couples living on the minimum wage and in receipt of the Parenting Payment saw a drop in affordability from 2.8 per cent to 0.5 per cent, while single parents on the minimum wage, supporting two children, saw a continuation of no properties at all being affordable and appropriate for them.
North West – Affordability
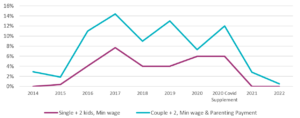
Source: Anglicare WA (2022) Rental Affordability Snapshot – Western Australia
The findings of this snapshot make clear how unaffordable the rental market has become for people on the minimum wage in WA. The very low level of accessible properties available to rent for households receiving government payments and for single minimum wage earners including single parents, strongly indicates the likelihood that many of those households will be living in housing stress or making do with housing that is not appropriate for their circumstances. Fewer appropriate and affordable housing choices often means that low-income households are being forced onto the fringes of the metropolitan region in order to find housing, putting them further away from jobs, schools and services and placing a greater strain on the weekly travel budget. The combination of financial stress and greater travel time also has a negative impact on workplace productivity and worker resilience.
The more of their income that households must dedicate to covering housing costs, the less they will be able to spend on other essentials like food, energy and health. It can also mean that any slight increase in their rent can have a dramatic impact on their ability to stay in a property and maintain the important connections they have established throughout their local community, along with their proximity to jobs and services.
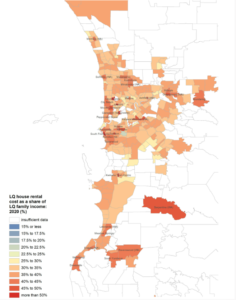
The following maps analyse rental stress for households in the lower quartile of incomes across Perth, with those areas in blue the most affordable and those in red the least. The first map shows housing rental costs while the second shows unit rental costs as a share of lower quartile household income.
Lower Quartile house rental costs as a share of lower quartile family income 2020
Lower Quartile unit rental costs as a share of lower quartile family income 2020
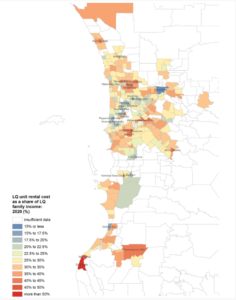
Source: Bankwest Curtin Economics Centre (2021) Housing Affordability in WA: A tale of two tenures
As can be seen clearly in the maps above, very few suburbs across the Perth metropolitan region are affordable for households in the lower quartile of incomes in those areas spending less than 30 per cent of their income on rental costs. Those areas in the second map that indicate a higher rate of unit rental affordability reflect comparatively higher family incomes in those suburbs, rather than more affordable rental costs, and greater levels of rental stress apparent among lower income families in Rockingham, Mandurah and Dawesville.[11]
Food
Low income is the strongest and most consistent predictor of food insecurity. Food insecurity is the state of being without regular access to a sufficient quantity of safe, nutritious food to meet an individual or household’s nutritional needs. It often corresponds with lower access to other basic needs, such as safe and affordable housing and secure employment as well as increased use of healthcare.
Low incomes together with competing living expenses act as compounding barriers to food security for many Western Australian households. The household food budget is often regarded as more flexible compared to other fixed household and health expenses, such as rent, utility and medical bills. As a result, a household receiving a low disposable income that experiences a sudden additional expense is more likely to lower their food budget, skip meals, or reduce nutritional quality to compensate.[12]
Anecdotal evidence from WACOSS member organisations providing food relief suggests that there has been a significant recent increase in people requesting emergency food relief across the state.
“Vinnies are witnessing unprecedented demand for food relief and has seen a significant increase in requests for food support over the last few years. From 30,000 people in 2017-18 to 45,000 in 2019/20 to an estimated 60,000 plus people in 2021/22. Our capacity is limited to 55,000 people for food relief based on existing resources. In real terms and referrals, our actual need is around 110,000 across the state.
At the moment Vinnies is doing around $100,000 a month in Food Cards and around $100,000 worth of food in donated hampers. An increasing area of concern is people who are homeless, living in caravan parks or crashing with other families, which is tied up in the ongoing and increasing cost of housing.”[13]
The Emergency Relief and Food Access Service (ERFAS) reports that emergency food relief needs in Western Australia have been steadily increasing over the past 12 months. The Service is designed to provide an easy access point between individuals seeking emergency relief and a local emergency relief (ER) provider. ERFAS was launched in late April 2020. To date 15,250 clients with 9,049 children have been provided with 19,245 ER pathways worth $820,281. Food relief requests have remained consistently high across the year-to-date.
Emergency Relief and Food Access Service Dashboard March 2022 – Types of Assistance Provided
Source: Financial Counselling Network
A range of factors have recently contributed to rising rates of food insecurity in WA, including: COVID-19 induced disruptions to employment, damage to critical food supply chains, increased food prices and rising cost-of-living pressures. These pressures are affecting a range of Western Australian workers and households with varying income levels. The Foodbank Hunger Report 2021 reveals that 64 per cent of food insecure Australians are employed. That is, food insecurity in Australia affects more working people than unemployed persons. The report provides a demographic breakdown of ten key ‘Hunger Segments,’ including:
- Young urban families with blue collar or low-income jobs coping with the increasing costs of children’s schooling and other activities;
- Well educated home leavers at the beginning of their careers struggling with the high cost of independent living on entry level incomes;
- Retirees and Empty Nesters living in cities or regional communities struggling to manage increasing costs on fixed incomes;
- Couples and young families with higher education and above average incomes contending with short-term financial shocks and cash flow issues;
- Older couples and families living in regional communities on low household incomes with already extremely modest lifestyles;
- Established families with higher asset wealth, contending with financial shocks and cash flow issues. [14]
According to the UBS Evidence Lab Grocery Study, Woolworths prices have increased by 4.3 per cent in the first quarter of 2022, while Coles’ prices have gone up 3.2 per cent.[15] Food manufacturer SPC are raising the prices of 100 Australian staple food items, such as baked beans and spaghetti, canned tomatoes and fruits, by as much as 20 per cent.[16]
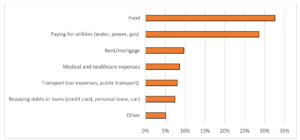
The West Australian examined a broad range of grocery items commonly purchased by consumers and found the total cost had jumped from $90.26 in 2019 to $141.68 in 2022 — a 57 per cent increase.[17] An increase in food prices of any magnitude will impact low-paid working households already engaged in strict budgeting measures who spend a large share of their income on food. Analysis from the Low Pay Report 2022,[18] conducted by WACOSS and Unions WA, reveals that food is the highest weekly budget priority for 22 per cent of households with annual income lower than $52,000, and the second highest weekly budget priority for 35 cent of households with annual income lower than $52,000.
Top weekly budget priority for households with annual income lower than $52,000 (n=175)
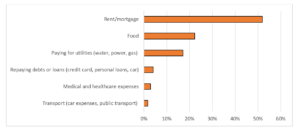
Second highest weekly budget priority for households with annual income lower than $52,000 (n=175)
Source: Perroni E. and Hansen, G. (2022)
Energy
The cost of energy also disproportionately impacts households on the lowest incomes, as they spend a significantly higher percentage of their disposable income on energy bills and have little, if any, capacity to absorb additional costs. People on the lowest incomes spend on average 6.4 per cent of their income on energy, compared to households in the highest income quintile, who pay on average only 1.5 per cent. Further, 25 per cent of the lowest income quintile are spending over 8.8 per cent of their income on energy. [19]
The disproportionate impact of electricity bills on low-income households can lead to mounting unpaid bills and a greater risk of disconnection, which in turn can have a significant impact on people’s wellbeing. Reported impacts include feelings of shame at being unable to provide for the family along with personal and relationship stress arising from difficult decisions about spending priorities.
Disconnections can have a range of detrimental impacts on households already struggling with everyday living costs. They can include the loss of food, an inability to bathe or to heat or cool rooms, or to maintain connection with relatives and the wider world. These impacts can lead to health problems, anxiety and emotional disorders increasing health system costs and reducing productivity. Energy debts can also affect a workers’ ability to access affordable credit in future.
Over late 2018 and early 2019, the 100 Families WA collaborative research project conducted a baseline longitudinal survey with 400 families living in Perth, as part of developing an ongoing evidence base on poverty and social exclusion in Western Australia. 13 per cent of family members were employed the week prior to survey, with one in twenty family members (5.5 per cent) reporting that they were working in a job of 35 hours or more per week.
The findings of the survey reveal the significant challenges and level of hardship being experienced by these Western Australian families. More than two-thirds of the 100 Families WA Project family members (67.8 per cent) reported that they could not pay their utility bills on time on at least one occasion during the year, while 23.3 per cent had been unable to heat their homes. 15 per cent said they could not afford to keep at least one room of their house adequately warm when it is cold. [20]
With Western Australia’s two residential electricity providers wholly-government owned, they provided an ideal mechanism through which the McGowan Government was able to supply economic assistance for households as the scale of the COVID-19 pandemic become apparent. This included a temporary boost to the Energy Assistance Payment, a moratorium on electricity and water disconnections and restrictions for people experiencing financial hardship.[21] From 1 November 2020, all households received a one-off $600 credit on their residential electricity bill, funded from the Bell Group settlement.[22] At the same time as the disconnection moratorium was introduced, it was announced that there would be no increases on all State Government household fees and charges until at least July 1, 2021.[23] This freeze followed a decision at the previous State Budget to increase household fees and charges by 2 per cent. The freeze ended, however, with the 2021/22 State Budget, with electricity charges increasing by 1.75 per cent for the representative household.
With the cessation of this support, households were again exposed to the pressures of energy costs. Figures obtained by The West Australian newspaper in March 2022, found that around 34,000 Synergy customers had experienced difficulties in paying their accounts over the summer period following the end of the moratorium on disconnections for those with significant electricity debts and subsequent increases in prices. This accounted for nearly 111,000 requests for assistance with their bills, with the average power bill between December 2021 and February 2022 having increased by 25 per cent, or in dollar terms, $67 to $329.[24]
Electricity charges have been increased again in the 2022/23 State Budget, by a further 2.5 per cent. To assist with living costs, the State Government has provided a one-off $400 electricity credit for every household.[25] Noting the average bill amount referred to above, this payment, though welcome, will likely only support households through one or two electricity bills at most, and does not resolve the underlying and continuing issue of insufficient household income.
The impact that this is having on households can be observed in the disconnection and Hardship Utility Grant application (HUGS) data that was reported in the Western Australian Legislative Council on 5 April 2022. As noted by the Economic Regulation Authority WA, disconnection data is a “valuable indicator of how affordable energy is to customers.”[26]
Synergy Disconnections between 1 August 2021 and 31 March 2022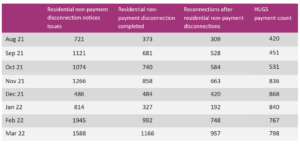
Horizon Power Disconnections between 1 August 2021 and 31 March 2022
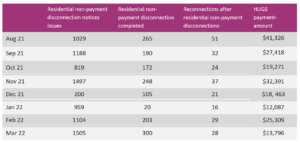
Source: WA Parliament Hansard
Note: Horizon Power does not record the number of distinct HUGS payments made; this data is held by the Department of Communities
Though these figures fluctuate due to seasonal variations and the typical hold on disconnections over the Christmas period, they clearly demonstrate that disconnections and the need for assistance have seen a significant uptick since the end of the moratorium and the impact of the $600 payment. Energy costs remain a critical concern for low-income workers and their households.
The WACOSS Cost of Living Report
The ability of low-income households in WA to achieve and maintain a basic standard of living is the focus of the annual WACOSS Cost of Living Report, which has been produced since 2007. Through this research, we seek to provide a picture of the challenges low-income households face year by year as they endeavour to ensure their living costs do not exceed their income.
The 2021 Cost of Living Report modelled five low-income household-types and examined the adequacy of their income to afford a basic standard of living in line with agreed community standards during the previous financial year. The 2021 Report, which included the period in which the Federal and State Governments introduced a range of financial supports, demonstrated the significant impact that an increase in income has on low-income household’s capacity to be able to meet the living standards generally prevailing in the community.
Rental costs rose dramatically for the model households for the third year in a row, while wage growth remained low during the financial year. Without the one-off coronavirus supplements and economic support payments, the rental cost increases would have left these households in a highly precarious position.
Weekly income and expenditure of our model households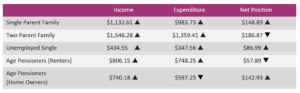
Source: WACOSS Cost of Living Report 2021
The households in the modelling above were continuing to see the benefit of the increased income support payments from the Federal Government and from the State Government’s $600 electricity credit during this period. At the time of this State Wage Case, however, all of these financial supports have been removed, while housing and living costs have continued to rise.
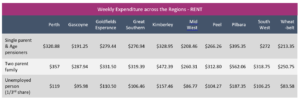
Costs in the Regions
When considering the adequacy of the State Minimum Wage it is important that differences in the cost of living for workers in regional areas are taken into account, especially in the north of the state. This is of particular importance for award-free employees, who do not benefit from location allowance requirements set out in many private sector awards.
Limitations of the data on detailed household expenditure patterns in the ABS Household Expenditure Survey mean there is insufficient detail to confidently extend the WACOSS household models from our Cost of Living Report to individual regions within WA. The data below accurately reflects the differences in costs of essential items, but we recognise that low income households living in these regions will change their actual expenditure patterns to compensate, so they can balance their weekly budget.
Analysis of rental costs for the four model households based on REIWA market data is included in the table below. It is important to note that availability can become an even more critical factor in regional areas with smaller housing markets and a more limited range of choice. While our analysis reflects the costs for the type of appropriate housing assumed in the four models, real households may not be able to secure appropriate housing in some regional centres, and so would be forced to compromise on either the appropriate dwelling size for their household composition, or on its affordability.
Source: Calculations based on REIWA market data
The Gascoyne is the most affordable region to rent in for the single parent and age pensioner model households, with rental costs lower by $129.63 per week for those household types than in Perth. The Wheatbelt is slightly more affordable for the working family and unemployed person, as a result of slightly lower median rental costs for houses in the region, but higher costs for renting units.
The Pilbara is the most expensive region for the single parent and age pensioner model households, spending $74.47 more each week than their equivalents in Perth. For the working family and unemployed single models, the Pilbara is also the most expensive region in which to rent, followed by the Kimberley.
Source: Calculations based on REIWA market data
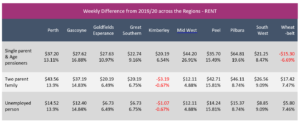
The cost of renting for both houses and units in the Pilbara rose significantly during 2020/21. Conversely, advertised rents for units in the Wheatbelt dropped, with small decreases also seen for houses in the Kimberley. The Mid West saw significant increases in the costs of renting a unit, with the increases for renting a house slightly more subdued.
Source: Calculations based on ABS 2015/16 HES, 2021 CPI and 2019 RPI data
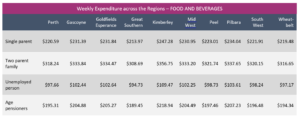
The cost of food and beverages is the highest in the Kimberley, followed by the Pilbara. Food prices in Peel, the Wheatbelt, the Southwest and Great Southern regions are all comparable to Perth metropolitan prices. Food prices in the Mid West and Gascoyne are also higher, being just slightly lower than in the Pilbara.
Source: Calculations based on usage data supplied by Horizon Power.
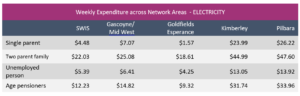
All model households are paying substantially more for electricity in the Pilbara and the Kimberley than those in the Southwest Interconnected System (Perth, Peel, Southwest and Great Southern). Model households in the Gascoyne/Mid West are spending slightly more than those in the SWIS, with the electricity expenditure of model Goldfields/Esperance households noticeably lower.
As the Uniform Tariff Policy means that Horizon Power customers are charged for electricity at the same rate as Synergy customers, these divergences are the result of different levels of energy consumption. Climatic conditions outside of the SWIS have a significant impact on the amount of energy required to maintain temperatures in homes at a liveable and comfortable level.
The high level of energy consumption and the resultant size of the bills, combined with their seasonal and intermittent nature, mean that low-income households in regional areas can be at substantial risk of bill shock, with the likelihood of falling into utility debt higher during the peak summer period.
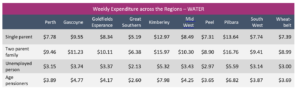
Source: Calculations based on average regional residential usage data supplied by the Water Corporation.
Households in the Great Southern Region are on average spending the least on water, followed by those in the Peel and Wheatbelt regions. Tariff cap policies mean that up to the first 300kL in ‘country south’ and 500kL in ‘country north’, residential water consumption charges are no more than metropolitan charges, after which the charges reflect the cost of providing services in the different country schemes. The lower water expenditure in those regions is thus a direct result of lower consumption.
Pilbara households are spending the most on water across all model household types. For example, our two-parent family are paying on average 43.6 per cent more per week or an extra $7.30 per week. The Pilbara is followed closely by the Kimberley, which would indicate that the climatic conditions in those regions result in a much higher level of water consumption by households.
Low Pay Report 2022
WACOSS, Unions WA and the Youth Affairs Council of WA (YACWA) report on low pay examines the impact of low wages on Western Australians.
The Low Pay Report 2022[27] composed an original survey instrument consisting of 13 questions designed to assess participants’ employment status, rate of pay, annual household income, weekly disposable income, job security, financial stress and weekly budget priorities. The survey consisted of both open-ended and closed questions. Open-ended questions were designed to provide qualitative data focusing on respondents’ views in relation to how their household is coping financially. In total there were a maximum of 1,394 respondents. After weighting, 178 survey respondents were classified as ‘low-waged’ workers, with an annual household income before tax that was lower than $52,000.
The findings of the report demonstrate that workers on low wages in Western Australia do not consider that their wages are increasing by the same proportion as their living costs, placing them in a state of financial stress or hardship. 66.3 per cent of respondents with an annual household income before tax that was lower than $52,000 reported that they had $100 or less a week after meeting their essential costs. 34.3 per cent reported that they had $50 or less a week after meeting their costs, the highest response for that income category.
Low-waged workers also reported the highest percentage of respondents falling behind into debt, at 15.4 per cent. Approximately 39 per cent of low-waged respondents identified that their income just met their cost of living.
The report further examines the disposable income and financial stress levels of just those respondents who reported an annual household income lower than $52,000, against those in that income bracket who were also in full-time employment.
Disposable income after essential costs for households with annual income lower than $52,000
Financial stress levels for households with annual income lower than $52,000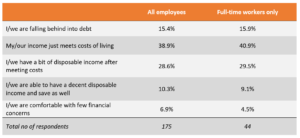
Source: Perroni E. and Hansen, G. (2022)
What this comparison indicates is that for those workers who are earning a low wage, access to full-time work is not in itself a guarantee that workers will earn enough to cover their basic needs or to avoid financial stress, hardship or debt. The fundamental problem is that the income of these workers is simply too low to meet cost-of-living expenses or to provide some discretionary income.
To better understand the level and types of financial stress impacting upon low-waged Western Australian households, the survey included the open-ended question “In your own words, how are you or your household coping financially”. Respondents’ testimonies described a variety of hardships that they experienced in trying to survive on their low wages.
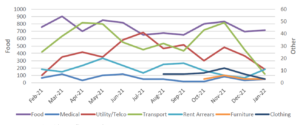
Many low-waged workers indicated that they were struggling with rising cost-of-living expenses, namely rent, groceries, fuel and utilities. Others indicated that they had no emergency savings safety net, were accessing savings or superannuation funds to cope with financial hardship and/or are worried about not having enough to finance retirement. Just 6.9 per cent of respondents in the low-wage category indicated that they were currently coping well. Workers across all employment categories – full-time, part-time and casual – indicated the hardships of living on low wages, as illustrated by the following responses:
“I have to draw on my superannuation to stay ahead. Utilities are becoming more expensive and I have to be careful what I buy food wise as many things (meat, fish, vegetables) are much more expensive now”
“Just managing, bills seem to increase electricity, water and health insurance for example but wages aren’t increasing at same rate. We are seriously looking at dropping health insurance which then puts more pressure on public health”
“Wage just covers cost of living – utility bills, insurances, rates, car, food, medical, phone, etc. I am unable to save, live pay to pay, and have been unable to get out of credit card debt, stuck on $4,500 overdraft. So financially just keeping my head above water, just.”
Emergency Relief and Financial Counselling Data
Evidence from Emergency Relief Providers
A number of WACOSS member organisations, including emergency relief, charitable food, financial counselling and family and domestic violence services, have reported to WACOSS month-on-month increases in people accessing their services due to rising levels of financial stress and hardship, likely compounded by the ongoing financial, social and health impacts of COVID-19.
These agencies consistently report a number of issues in relation to people living in financial hardship in Western Australia, including:
- The number of people seeking assistance with poverty-related issues is growing;
- There is an increase in new groups of clients, i.e. people seeking assistance who have not previously sought assistance, and in particular a growth in the number of ‘working poor’ approaching agencies for assistance;
- A large number of clients are returning to emergency relief services who have not requested assistance for more than 5+ years; and
- Rising cost-of-living pressures, particularly housing costs, are severely impacting vulnerable groups, with households having to choose between meeting housing costs and other items of essential expenditure such as food.[28]
WACOSS operates a free online directory of community service providers for people looking for emergency relief and assistance, called WAConnect. The directory allows us to track real time search results of emergency and community relief providers, including food relief, financial counsellors, emergency accommodation and other services as well as searches by individuals in hardship seeking assistance.[29]
From 1 January 2022 to 31 March 2022, the portal registered a total of 23,200 visits from 15,600 users, generating 86,700 searches for services. When comparing these statistics to the numbers registered same period last year (2021), the number of users have increased by 46.5 per cent, the number of visits to the site by 43 per cent, and the number of searches for services within the portal increased by 35 per cent (equivalent to ~22,000 more searches for services).
The most searched for services included: help with food (~ 7,800 searches); help with money, including overdue bills assistance, financial debt and debt services, rent assistance and more (~4,400 searches); help with accommodation (~ 3,500 searches); and help with fuel and related expenses (~2,000 searches).
This increase in the platform’s usage registered year after year reflects both increasing awareness of the platform and the continued impact of the cost-of-living increases in the Western Australia.
Financial Counselling Data
Financial counselling is a free and independent service to assist people who are experiencing financial difficulty. A qualified financial counsellor will work through a person’s weekly household income and expenditure with them to provide expert advice on how to tackle their financial challenges.
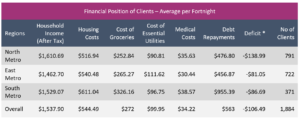
WACOSS has analysed data provided by the Financial Counselling Network[30] of 1,884 clients who accessed their services from January to November 2021 to reveal the real-life living cost pressures being faced by households across the Perth metropolitan region who are experiencing financial hardship and stress.
Source: Calculations based on data supplied by the Financial Counselling Network.
* Note: ‘Deficit’ is the average amount that the expenditure of each financial client was above or below their income and so does not equal the expenditure columns subtracted from ‘Household Income (After Tax)’.
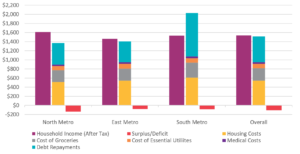
As many people seek assistance from financial counsellors in relation to debts they are struggling with, it is not surprising that these clients have substantial debt repayments each fortnight. When it is considered how much of their income is required in order to service these debts, the burden that these debts have on these households is readily apparent. With the average proportion of income needed to cover their debt repayments in the North and East metropolitan regions of Perth nearing the average proportion of income needed to keep a roof over their head, while in the South metropolitan region far exceeding it, this data makes clear the stark reality of high debts in the community.
Percentage of Household Income (After Tax) on Expenditure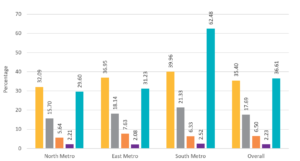
Source: Calculations based on data supplied by the Financial Counselling Network.
Financial counsellors may be able to contact their clients’ creditors to halt or defer debt-recovery proceedings, negotiate debt waivers or reductions, and put in place a payment plan. They may also be able to provide access to emergency relief in the form of charitable donations or food parcels to help them through an immediate crisis.
However, some households may turn instead to payday loans and other fringe financial lending to help resolve short-term financial problems, only to result in increasing levels of longer-term financial stress. These households are least able to secure standard lower-interest rate loans and are to some degree ‘forced’ into borrowing funds from questionable short-term lenders to deal with immediate financial crises, exacerbating their financial hardship. Households pursuing this type of credit to resolve other debts and cover everyday expenses pay a significant premium for access to instant-cash and may be vulnerable to misleading and predatory lending practices that can lead to further spiralling debt.[31]
As mentioned earlier, when households in the lower 40 per cent of incomes are spending more than 30 per cent of their gross income on housing costs, they are deemed to be in housing stress.[32] With the costs above represented as percentages of income after tax, it can be observed that financial counselling clients in each metropolitan region of Perth are on average in housing stress (spending between 32 to 40 per cent of their income on housing costs), with those in the South metropolitan region dedicating the greatest proportion of their income to their housing costs (40 per cent).
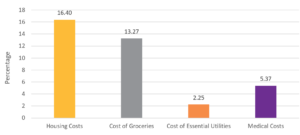
Comparing this data to that of the 2017 ABS Household Expenditure Survey (HES) illustrates the significant differences between the expenditure patterns of the average Western Australian household and those experiencing financial hardship.
Percentage of Income on Expenditure – ABS Household Expenditure Survey
Source: Calculations based on the ABS (2017) Household Expenditure Survey
While prices and incomes have changed since this survey was undertaken, some very clear differences between the financial counselling clients and the HES participants can be observed. The proportion of income that the financial counselling clients are dedicating to housing is substantially higher than it was for the average WA household in the HES. Similarly, the financial counselling clients have a much greater proportion of their income being spent on covering the costs of their utilities like electricity, gas and water.
The financial counselling clients can also be observed to be spending a much lower percentage of their income on medical costs than the average WA household in the HES. This would suggest that medical costs are an area that the financial counselling clients have been forced to avoid spending on in order to cover their other living costs, which will likely have a negative impact on their quality of life and personal health. When low income households forgo basic and ongoing medical expenditure it ultimately costs us all more as a community, as it inevitably leads to higher rates of chronic disease in the longer term, greater reliance on hospital emergency departments, and higher morbidity and mortality rates.
Poverty and Inequality
Defining and Measuring Poverty
There are two main approaches to defining and measuring poverty – relative measures and depravation measures. Both are effectively seeking to do the same thing, which is to come up with a reliable way to assess the prevalence and impact of low incomes on individuals or households within the community, compared to the expectations the community holds in common of a basic but acceptable standard of living.
Depravation measures are arguably a more accurate way to represent community standards. They work by polling the population on the different components considered necessary for daily living – such as shelter, warmth and basic nutrition – then determining that basket of basic goods and services the majority of us agree are needed and reasonable to expect within our society. The best-known example of depravation measures in Australia is the Henderson Poverty Line which was established in 1973 and set a basic household benchmark income level of $62.70 per week after tax, equivalent to 56.5% of average weekly earnings.[33] This was roughly equivalent at the time to the value of the basic wage and the child endowment payment for an average family with two children.
The challenge with depravation measures of poverty is that they are resource intensive. Relative measures of poverty in contrast seek to set a particular income threshold in comparison to average or median wages that is thought to represent the level of income required to support a basic standard of living. The most common thresholds are 50% of median income (the common standard in Australia) and 60% of median wages (the benchmark used in the OECD). Relative measures have the benefit of being comparatively easy to measure and track over time but are sometimes criticised for being an arbitrary comparison to actual living costs.
In practice poverty researchers and policy makers tend to make regular use of relative poverty measures, while periodically doing more detailed depravation studies, to make comparisons between income levels, living costs and community expectations. Ongoing periodic surveys such as the ABS Household Expenditure Survey (HES) and the Melbourne Institute Household Income and Labour Dynamics in Australia survey (HILDA) together with attitudinal polling allow us to compare household expenditure patterns and median household incomes over time to determine how well weekly incomes compare against an acceptable basket of basic goods and services.
The Fair Work Commission’s Expert Panel said in its 2019-20 Decision:
Consistent with previous Review decisions, we accept that if the low paid live in poverty then their needs are not being met. In measuring poverty we continue to rely on poverty lines based on a threshold of 60 per cent of median equivalised household disposable income and that those in fulltime employment can reasonably expect to earn wages above a harsher measure of poverty.[34]
WACOSS supports the use of a 60% poverty line by the FWC as representing “…a fair and appropriate comparison for determining a system of fair wages and conditions of employment that meet the needs of the low paid and provide for fair wage standards in the context of living standards generally prevailing in the community.”[35] In comparison the Henderson Poverty Line was initially set at a level equivalent to 56.5% of average weekly earnings, at a time when basic housing costs were considerably less of the weekly budget, and community expectations of acceptable living standards were more frugal and less inclusive than they are today (for example, you did not need internet connectivity then to exercise your basic citizen rights and access universal public services).
Recent Poverty Analysis
The latest report in Bankwest Curtin Economics Centre’s (BCEC) Focus on the States Series, Behind the Line: Poverty and disadvantage in Australia 2022, demonstrates that there is a significant share of people in Australia who are employed, but whose incomes keep them below a 50 per cent poverty line. [36] Results are based on representative population data drawn from the Household Income and Labour Dynamics in Australia (HILDA) survey 2021 data set.
BCEC use an income poverty measure set at 50 per cent of the typical (median) standardised incomes, controlling for housing costs. Findings indicate that in 2020, 8.8 per cent of people living in poverty were in fulltime employment (that is, earning below 50 per cent of equivalised median income) and a further 10.8 per cent of those living in poverty were part-time workers. Taken together, that is nearly 20 per cent, or one in five, of people living in poverty who are working.
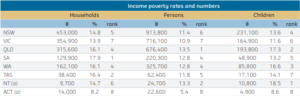
Further analysis by BCEC reveals the number of people in poverty across states and territories. The rate of individual poverty in Western Australia is calculated at 12.8 per cent, equating to 325,700 people. Applying the findings above, it can be estimated that roughly 64,000 Western Australians living in poverty are working, and approximately 29,000 of those working full-time. These proportions will be greater again when based on the threshold of 60 per cent of equivalised median income accepted by the Fair Work Commission Expert Panel.
Poverty rates and counts by state/territory: 2020
Source: Duncan (2022) | Author’s calculations based on HILDA Survey waves 2 to 20 (2002-2020)
Note: Due to smaller sample sizes, NT and ACT figures are averaged over two years, 2019 to 2020. Poverty calculations are based on real equivalised household disposable incomes, after housing costs. Nil and negative incomes are excluded from poverty calculations. Housing costs included mortgage repayments, rent and property rates.
BCEC’s modelling reveals a poverty line of $544.19 per person per week at the 60 per cent relative poverty threshold, once housing costs have been paid. They have further calculated the equivalent poverty lines for family income by using the OECD modified equivalence scales, as well as providing an indication of poverty depth by adjusting the percentage of median income that defines the degree of poverty. These include a threshold of 30 per cent of median equivalent per capita income, categorised as severe poverty.
Poverty line equivalences
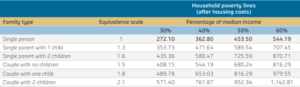
Source: Duncan (2022) | Author’s calculations from HILDA Survey Waves 2-20 (2002-2020)
Note: Poverty lines are calculated for real equivalised household disposable incomes (after housing costs). Nil and negative incomes are excluded from poverty calculations. Data are re-based to December 2021 prices. Housing costs included mortgage repayments, rent and property rates.
Financial Stress and Hardship
The impact of COVID-19 on employment and earnings exposed how deeply and broadly financial precarity can affect not only low-wage workers, but a large portion of the population. Over the last 24 months, Western Australian households have been exposed to sudden disruptions to financial stability, employment, secure and affordable housing, relationships and social connections, all of which cumulatively impact upon their financial wellbeing.
Recent survey research indicates that lower-income earners are reporting higher levels of financial stress (that is, anxiety-driven stress about finances) and financial hardship (that is, difficulty in meeting household living expenses and repaying debts) than higher income earners.
The National Australia Bank Household Financial Stress Index[37] demonstrates a persistent economic divide as financial stress disproportionately impacts lower income earners relative to higher income earners.[38]
NAB Financial Stress Index: Lower/Higher Income, Q4, 2021
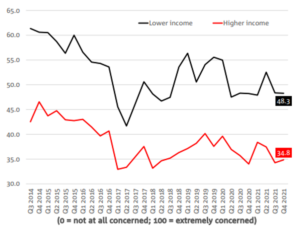
Source: NAB Behavioural and Industry Economics (2022)
This gap is consistent across all NAB financial stress metrics, with the largest margins evident in: raising $2000 for an emergency (53.3 points compared to 32.1 points in the higher income category); food and basic necessities (44.6 v 27.8); other monthly household expenses (48.3 vs 31.5); monthly utility bills (46.7 vs 31.6); and not having enough for non-essential, discretionary expenses (51.7 vs 36.9).[39]
NAB Financial Stress Index by Income Group (Q4, 2021)
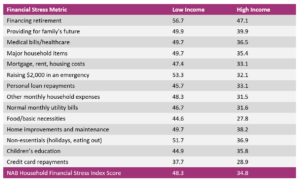
Source: Adapted from NAB Behavioural and Industry Economics (2021)
Across 2021, financial hardship levels were persistently high among the low-income earner cohort, with approximately one in two experiencing difficulty in meeting household living expenses and debts.[40] As a result, one in five low income earners are running out of money before their pay period ends, and one in four are drawing down their savings (if they have any). Noticeably more low-income earners are challenged by not having enough money left to save after spending on bills, debts and everyday expenses than high income earners (35 per cent vs 21 per cent, respectively).[41]
Similar results are replicated through further institutional research surveys. The ANZ 2021 Financial Wellbeing Survey[42] measures the financial wellbeing of 3,552 randomly selected Australian adults across different life stages and locations in May and June, 2021. Financial wellbeing is described as “the extent to which someone is able to meet all their current commitments and needs comfortably, and has the financial resilience to maintain this in the future.”
Participants’ responses were converted into financial wellbeing scores out of 100, derived from measures for four components of financial wellbeing: meeting everyday commitments, feeling comfortable, financial resilience, and feeling secure for the future. The bottom 11 per cent of respondents were considered “struggling” (with a financial wellbeing score 0-30), 17 per cent were “getting by” (financial wellbeing score >30-50), 43 per cent were “doing OK” (financial wellbeing score >50-80) and the top 29 per cent were considered to have “no worries” (financial wellbeing score >80-100).
Income Association with ANZ Financial Wellbeing Score (out of 100)
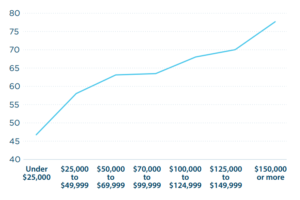
Source: Australia and New Zealand Banking Group Limited (2021)
The results reveal a clear association between financial wellbeing and income; the lower the income, the lower the financial wellbeing score and vice versa. People classified as “struggling”, 18 per cent of which are employed full-time, had the lowest average financial wellbeing score of 19 out of 100. “Struggling” Australians were more likely than the general population to be women (60 per cent), renting (65 per cent), divorced (44 per cent), single parents (18 per cent), aged 25-34 years old (26 per cent), or living in a shared household (11 per cent). They were more likely to report rarely or never having money left over after food and other regular expenses (76 per cent) as well as suffering a long-term health condition, impairment or disability (46 per cent), poor physical (16 per cent) or mental (32 per cent) health.
The ANZ 2021 Financial Wellbeing Survey also highlights the occupations in which workers experienced large declines in financial wellbeing. These include: food trades (down 18.6 per cent); arts and media professionals (down 16.8 per cent); construction trades (down 16.5 per cent); personal assistants and secretaries (down 15.8 per cent); store persons (down 15.6 per cent) and hospitality workers (down 11.9 per cent). There is considerable overlap between workers in these industries reporting the largest declines in financial wellbeing with industries with a high degree of award reliance in this State, including accommodation and food services, retail trade, arts and recreation.
Percentage change in financial wellbeing of occupational groups across Australia
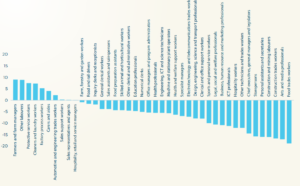
Source: ANZ Roy Morgan Financial Wellbeing Indicator
Taken together, the findings of these surveys demonstrate that lower income households are significantly more likely to be in severe financial stress or hardship compared to higher income households, and that access to paid work alone may not be enough to lift someone above the poverty threshold.
Financial stress has a range of significant short and long-term impacts on households, ranging from households needing to forgo essential expenses such as groceries, medicine, education or heating, to family breakdowns and subsequent impacts on child development and safety, to increased risk of violence and substance abuse.
With the continued impact of COVID-19 across Western Australia and increasing volatility of markets due to global instability, the risk for further economic shocks to low-waged workers and households remains high. An increase of 7.6 per cent in the minimum wage is needed to improve the situation of low-waged workers and ensure everyone in our community is able to affordably access essential goods and services.
Income Inequality and Wages
COVID-19 acutely exposed and exacerbated existing inequalities in the labour market. These problems include rising wage inequality, stagnant wage growth, the persistent gender pay gap, scarring effects on young people’s labour market outcomes, and widening inequality between those who earn their income from labour and those who rely on capital returns.[43]
The Fair Work Commission’s Expert Panel has consistently adopted a threshold of two-thirds of median adult full-time ordinary earnings as the benchmark to identify who is classified as ‘low paid’.[44] The growth in the gap between the state minimum wage rates and median pay levels has contributed to income inequality in Western Australia.
As of November 2021, the State Minimum Wage was only 41 per cent of the WA Average Weekly Ordinary Time Earnings (AWOTE). In comparison, the National Minimum Wage comprises 44.2 per cent of Australia-wide seasonally adjusted average weekly earnings as of November 2021. In November 2005, the State Minimum Wage was 47.6 per cent of the WA AWOTE.
WA AWOTE, Median Earnings and State Minimum Wage
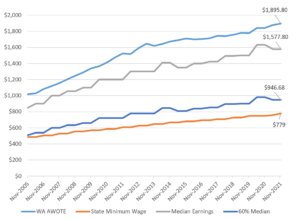
Source: ABS 6302.0, 6333.0, and WA Department of Commerce
The SMW has not kept pace with relative poverty thresholds such as 60 per cent of the median, with the gap increasing over recent years. The SMW is currently $167.68 below the 60 per cent of median earnings poverty line for November 2021. Low wage growth has, for several years, been identified as a serious problem for the Australian economy.[45] A continued extended period of stagnating wage growth will likely bring a range of negative material and social outcomes for Western Australian households, and undermine Australia’s economic recovery from COVID-19. Economic experts warn of the significant economic and social consequences of wage stagnation: it undermines household financial stability, consumer spending, further productivity growth and government revenues.[46]
Australia is today facing the slowest rate of wage growth since the wage price index (WPI) was first established in 1997.[47] The possibility of this trend continuing into the future was outlined in the recent Federal Budget Papers, which forecasts that real wages will not return to above 2019 levels until 2025.
The International Labour Organisation’s ongoing analysis of global wage trends has identified the social and economic consequences of stagnating average wages:
On the social side, the disconnect between economic growth and wage growth means that workers and their families do not feel that they are receiving a just share of the fruits of economic progress, which fuels their frustration. On the economic side, low wage growth dampens household consumption, which can reduce aggregate demand, particularly when wages stagnate in many large economies at the same time.[48]
The deceleration of Australian wages has been linked to particular policy and institutional contexts. Cavenough (2022) examines wage growth between two six-year observation periods, 2007-2013 and 2014-2021, revealing a marked decrease in wage growth during the second period.[49] The average annual increase in Average Weekly Ordinary Time Earnings (AWOTE) under the first observation period was 4.6 per cent, compared with 2.5 per cent in the second observation period. Cavanough observed that the variation in annual increases in AWOTE over the two periods reflected differences in wage policy taken by successive governments.
According to Cavenough’s analysis, if AWOTE growth had continued at 2007-2013 rates, the average Australian worker today would be earning $307 more per week. In Western Australia, workers would be on average $641 better off each week.
Average Weekly Ordinary Time Earnings (AWOTE) across two observation periods and effect on weekly earnings
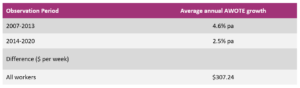
Source: Cavenough (2022)
Currently, nominal wages are lagging well behind consumer prices. Real wages (accounting for inflation) are therefore falling. According to the Australian Council of Trade Unions, a worker on the average income of $68,000 in 2021 effectively had a pay cut of $832, as increases in cost-of-living outpace increases in wages.[50] When wages and income support payments are inadequate, people are forced to rely on charitable assistance and emergency relief. The increase in the people searching for and accessing emergency relief are detailed in section 4.1.
Without strong growth in wages over coming years, the legacy of the pandemic will be a vastly more unequal society. An appropriately set increase of 7.6 per cent in the minimum wage is essential to support working families to keep pace with the inflation of prices in such essential goods and services such as housing, energy, fuel, food, and health services. Moreover, higher wages for low and middle-income earners translates directly to more consumer spending in local economies, supporting Western Australia’s small businesses and regional economies.
Gender Wage Gap
A gender wage gap remains a standout characteristic of the Western Australian labour market, with the widest gender pay gap in the nation at 21.2 per cent.[51] This figure underscores women’s significantly lower earnings relative to men’s, which has ramifications for lifetime earnings, superannuation savings and security in retirement, the likelihood of women living in poverty in older age, or the ability for women to escape violent and coercive relationships.
There are many contributing factors that lie behind the gender pay gap and accordingly, there is a range of policies and measures that can progressively reduce gender pay gaps, including wage policies. The ILO confirms that minimum wages have been found to be effective at reducing gender pay gaps, particularly at the lower-end of the wage distribution,[52] as have several other international studies.[53] For example, Eurofound (2021) highlights how women workers benefited disproportionately from the increases in real minimum wages that have been implemented in most EU member countries over the past decade.[54]
There is a significant body of research highlighting and describing the causes of the gender pay gap. Relevant to the Review, one of the primary causes is the relatively lower pay rates in female-dominated industries and occupations. According to analysis by Pennington and Wenlock (2021), industries in Australia employing 50 per cent or more women workers are all in the bottom half of industries according to earnings, including: hospitality, retail, arts, administration, healthcare, social services and education. Public administration and safety is one exception, ranked 7th out of 19 industries.
Average weekly earnings across all feminised industries (defined as 50 per cent or higher in women’s employment) were $1,074, compared with $1,674 in male-dominated industries, amounting to $600 less per week for workers in feminised industries.
The Western Australian workforce remains highly gender segregated. Industries and occupations that employ more women workers are characterised by high levels of award dependency and lower wages. The Western Australian workforce is further characterised by a persistent minimum wage gender divide, with a higher percentage of women earning at or below the minimum wage than men.
Percentage of employed persons (aged 15+) in Western Australia who earn the minimum wage or less in their main job by year and sex
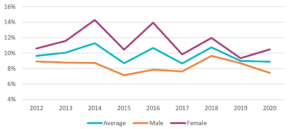
Source: Professor Alison Preston, UWA Public Policy Institute[55]
In their submission to the Fair Work Commission’s 2021-2022 Annual Wage Review, the Western Australian Government notes the particularly high level of award reliance in three of Australia’s largest employing industries – Health Care and Social Assistance, Retail Trade and Accommodation and Food Services – all of which are feminised industries.[56] They further submit that minimum wages can make an important contribution towards lowering the gender pay gap.
The Western Australian Government submits that the higher incidence of award reliance amongst female employees highlights why the AWR process, involving annual adjustments to minimum and award wages, still plays an important role in gender pay equity considerations.[57]
Lower female wages are a salient contributor to gender wealth gaps in general, including the gender gap in retirement savings. As women continue to earn less than men and are more likely to be engaged in casual and part-time work, these combined factors can have a negative impact on their overall financial security, with less accumulated superannuation and fewer savings for retirement. Wage rates directly affect super contributions, and with women disproportionately represented in minimum-wage and award-reliant jobs, they are more reliant on such instruments to set their wages than men. [58] A meaningful adjustment to the minimum wage is therefore important for many Western Australian women, not only to maintain a dignified standard of living during their working lives, but to achieve greater financial security in retirement.
As the peak organisation in the WA non-government community services sector, WACOSS has a particular interest in employment issues in community services. The vast majority of employees in the community services sector are women. Community services workers are highly skilled professionals with extensive education and training. They provide essential services to our most vulnerable community members, many with complex needs, yet their work remains undervalued and low-paid. Many of these professional community services workers are completely award-reliant. Low pay is forcing workers to leave the sector, while contributing to serious staff shortages in WA’s regional areas and workers being priced out of their own communities.
A report by the Australian Aged Care Collaboration (AACC)[59] for example, reveals that a full-time income of a single parent working in aged care is not enough to cover essential expenses. The report compared average wages for workers in the residential and home care sectors against key cost of living indicators including average rents, childcare expenses, grocery costs, and petrol. Expenses were then compared to income earned by a certificate III qualified personal care worker employed at the award rate for a 38-hour week, who would earn $900 a week, or $773 after tax.
Based on average earnings and expenses, “an aged care worker in a single-parent household would not be (able – sic) to cover even basic expenses without working extra hours, working late nights or weekends, and relying on additional government benefits,” the report found, with an estimated weekly shortfall of $148.[60] An aged care worker in a single household would have $112 remaining per week after basic living costs to cover other monthly and quarterly bills such as telecommunications and utilities, as well as incidental household expenses.
WACOSS submits that an increase of 7.6 per cent to the State Minimum Wage is an important lever to help address the gender pay gap across all industry sectors, particularly in low paid, female-dominated and growing sectors, such as health care and social assistance. It may also help redress labour shortages in the community services sector, while ensuring workers are fairly paid and well-supported to provide quality care to Western Australia’s most vulnerable community members.
Young People
Young people are highly concentrated in precarious forms of work, including casual and ‘gig economy’ work and are overrepresented in industries reliant on minimum wages, such as accommodation and food services, arts and recreation services and retail sales. These industries were not only most severely affected by the impact of COVID-19, but young people were also under-represented in JobKeeper coverage, leading to significant financial and mental health impacts for this cohort.[61]
While exposure to a recession can have long-lasting negative effects on the employment and earnings of workers across the board, these effects are particularly damaging for younger workers who are just entering the labour market with little to no work experience in low-paid occupations. Analysis of the Household, Income and Labour Dynamics in Australia (HILDA) data reveals that 74.7 per cent of all WA employees whose hourly wage is at or less than the national minimum wage are aged 18-24.
Proportion of workers receiving less than the national minimum wage by age
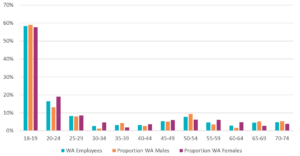
Source: Professor Alison Preston, UWA Public Policy Institute[62]
Research on prior recessions shows that young workers who enter the labour market during an economic downturn are scarred for many years.[63] These workers are more likely to experience lower earnings, greater earnings instability, and more spells of unemployment in the long term compared with similar individuals who entered the labour market in better times.[64] Further, due to this disadvantaged start, there is an increased chance that young workers entering the labour market get stuck in low-paying, low-quality jobs.[65] Even when the economy gets stronger, it can be difficult for these workers to catch up to their pre-recession cohorts.
Analysis by the Everybody’s Home campaign shows that an 18-year-old hospitality or retail worker would struggle to pay the rent in Perth. The analysis cross references the average rent of a single bedroom in a two-bedroom apartment across Australian capital cities against the weekly wage of a level 1, 18-year-old hospitality or retail worker. It found that in Perth, rent absorbed 35 and 39 per cent of income for young retail and hospitality workers respectively, a figure that indicates rental stress.[66]
Young people are also over-represented amongst the unemployed. In November 2021, the unemployment rate for males aged 15 to 19 years was 16.8 per cent while the rate for females aged 15 to 19 years was 13.0 per cent. In comparison, the overall unemployment rates for all workers (aged over 15 years) were 4.3 per cent for all males and 4.2 per cent for all females.[67] The higher rates of unemployment for Australian youth have been attributed to (i) crowding out of employment due to an increase in labour supply by older workers; and (ii) scarring effects from entering the labour market during difficult economic conditions.[68]
There is scant research examining the relationship between the minimum wage and youth employment in Australia. Sturn’s investigation of the impact of minimum wages on low-skilled or youth employment in a sample of 19 OECD countries (including Australia) found little evidence for substantial disemployment effects and determined that minimum wages “are unlikely an economically relevant determinant of job losses for low-skilled, female low-skilled, or young workers in OECD countries.”[69]
Indeed, the opposite trend appears to be the case in Australia; youth unemployment rates have been rising even though workers aged 15–34 years have experienced either negative or zero average annual wage growth in the decade leading up to 2018.[70] Stagnating or declining real wage rates mean that young people’s purchasing power is not improving (and so neither is their material wellbeing). Slow, negative or zero wages growth for young people has particular policy implications, including policy related to university tuition fees and subsidies, student debt, retirement incomes, minimum wages and equity.[71]
While increasing the minimum wage would aid workers across the age spectrum, young workers, who are the most likely to be earning very low wages, experiencing stagnant wage growth, and facing significant cost-of-living pressures, would see multiple benefits. Raising minimum wages will further be a key enabler for younger workers to live decently, support their wellbeing, and play the role required of them in the broader economic recovery.
Conclusion
It is view of WACOSS that in order to “ensure that Western Australians have a fair system of wages and conditions; meet the needs of the low paid; provide fair wage standards in the context of living standards generally prevailing in the community; and contribute to improved living standards for employees”[72] the State Minimum Wage needs to be raised by 7.6 per cent.
WACOSS is concerned that an increase that is set at a level any lower than this will result in low paid households falling even further behind the sharply escalating living costs that we have documented. This submission has laid out in detail the scope of the challenges that low paid households are facing in Western Australia at present and has argued that it is an increase to the minimum wage that will assist in addressing them.
The State Minimum Wage has a crucial role in addressing poverty and income inequality in Western Australia. A sufficient income, coupled with safe and secure shelter, is essential for people to be able to fully engage in our community. Conversely, the absence of a decent income and shelter are the foundations for entrenched disadvantage, compounding the other challenges people may face.
As detailed in our Low Pay Report, Western Australian workers told us that their wages are simply not increasing by the same proportion as their living costs. They spoke of the challenges and stress this creates for them, including having to access their savings or superannuation, turning to emergency relief services, or being forced to cut their spending on essential items to compensate for low wages.
WACOSS’s claim of a 7.6 per cent increase to the State Minimum Wage will deliver an undeniable benefit to many of the lowest-paid workers, and their families. A strong minimum wage — one which ensures workers are provided with a decent living standard, well above poverty levels is integral for an inclusive and sustainable economy, where the benefits are shared with all Western Australians.
Download a PDF version of this Submission.
References
[1] Industrial Relations Act 1979 (WA)
[2]Hon Mark McGowan MLA (2022) Western Australia State Budget 2022-23: Budget Paper No.1: Treasurer’s Speech. Government of Western Australia.
[3] Duncan, A. (2022) Behind the Line: Poverty and disadvantage in Australia 2022, Bankwest Curtin Economics Centre Focus on the States Series, #9. Note that this is the most recent poverty line analysis we are aware of, using 2021 HILDA data.
[4] Hon Mark McGowan MLA (2022) ‘SP Global rates WA a world leader for financial ‘outperformance’’ Media Statements, Government of Western Australia
[5] Hon Mark McGowan MLA (2022) ‘WA jobs growth defies Omicron and leads the nation’, Media Statements, Government of Western Australia
[6] Australian Bureau of Statistics (2022) Consumer Price Index, Australia, March 2022
[7] Bankwest Curtin Economics Centre (2021) Housing Affordability in WA: A tale of two tenures
[8] REIWA (2022) Perth home values increase again in April
[9] ACOSS/UNSW Poverty and Inequality Partnership (2020) Poverty, Property and Place: A geographic analysis of poverty after housing costs in Australia, City Futures Research Centre & the Social Policy Research Centre
[10] Anglicare WA (2022) Rental Affordability Snapshot – Western Australia
[11] Bankwest Curtin Economics Centre (2021).
[12] Booth S, Smith A. Food security and poverty in Australia — challenges for dietitians. Australian Journal of Nutrition & Dietetics. 2001;58(3):150–6.
[13] WACOSS/St Vincent de Paul Society (WA), email correspondence, 22 April 2022.
[14] Foodbank (2021). Foodbank Hunger Report 2021.
[15] Hales, H. (2022) Reason for hike in Australian grocery prices revealed. The West Australian.
[16] Mizen, R. (2022) Baked beans, spaghetti up 10-20pc as inflation bites. Australian Financial Review.
[17] Enciso, C. (2022) Cost of living: The shock increase in total cost of a grocery shop since 2019 revealed. The West Australian.
[18] Perroni E. and Hansen, G. (2022) Low Pay Report 2022. Western Australian Council of Social Service and Unions WA.
[19] ACOSS and the Brotherhood of St Laurence (2018) Energy Stressed in Australia
[20] Ami Seivwright and Paul Flatau (2019) Insights into hardship and disadvantage in Perth, Western Australia: The 100 Families WA Baseline Report. The 100 Families WA project.
[21] Hon Mark McGowan MLA, Hon Ben Wyatt MLA (2020) ‘$1 billion COVID-19 economic and health relief package unveiled’, Media Statements, Government of Western Australia
[22] Hon Mark McGowan MLA, Hon Ben Wyatt MLA, Hon Bill Johnston MLA (2020) ‘Every WA household to receive a $600 electricity bill credit’, Media Statements, Government of Western Australia
[23] Hon Mark McGowan MLA, Hon Ben Wyatt MLA (2020) ‘COVID-19 economic response: Relief for businesses and households’, Media Statements, Government of Western Australia
[24] Joe Spagnolo (2022) ‘Thousands of WA families unable to pay power bills as cost of living soars’, The West Australian
[25] Hon Mark McGowan MLA (2022) ‘Strong surplus delivers all WA households a $400 electricity credit’, Media Statements, Government of Western Australia
[26] Economic Regulation Authority (2020) Annual Data Report – Energy Retailers 2018/19
[27] See Appendix for full report
[28] C Twomey, E Perroni, G Hansen, C Stephens and A Gregory (2021) Beyond Recovery. Submission for the WA State Budget 2022-23. Western Australian Council of Social Service.
[29] https://waconnect.org.au/
[30] The Financial Counselling Network is a partnership of not-for-profit community service organisations and local government across the Perth metropolitan region who provide advice, assistance and education to people experiencing financial hardship. https://www.financialcounsellingnetwork.org.au/.
[31] SACOSS Consumer Credit Legal Service Scoping Study
[32] Australian Bureau of Statistics (2017) 4130.0 – Housing Occupancy and Costs, 2015-16
[33] Ronald Henderson was the chair of the Commission of Inquiry into Poverty established by Prime Minister William McMahon in 1972. See The Calculation and Use of Poverty Lines in Australia, The Melbourne Institute.
[34] Fair Work Commission (2020), Annual Wage Review 2019-20 decision, page 85. https://www.fwc.gov.au/awards-agreements/minimum-wages-conditions/annual-wage-reviews/annual-wage-review-2019-20
[35] Western Australian Industrial Relations Act 1979, Clause 50A(3)(a).
[36] Duncan, A. (2022) Behind the Line: Poverty and disadvantage in Australia 2022, Bankwest Curtin Economics Centre Focus on the States Series, #9
[37] NAB Behavioural and Industry Economics (2022) NAB Australian Wellbeing Survey: Beyond GDP: Insights into wellbeing, and the role money & finances play in our lives. National Australia Bank, Q4, 2021
[38] NAB classify lower income earners as typically earning less than $35,000 per annum while higher income earners are those earing above $100,000 per annum.
[39] Ibid.
[40] Ibid.
[41] Ibid.
[42] Australia and New Zealand Banking Group Limited (ANZ) (2021) Financial Wellbeing: A Survey of Adults in Australia, December 2021.
[43]UNSW & ACOSS (2022). COVID, Inequality and Poverty in 2020 & 2021. How poverty & inequality were reduced in the COVID recession and increased during the recovery. Build back fairer report series, report no.3.
[44] Fair Work Commission (2021). Annual Wage Review 2020-21 decision, page 38: https://www.fwc.gov.au/documents/decisionssigned/html/pdf/2021fwcfb3500.pdf
[45] Clibborn S. (2021) Australian industrial relations in 2020: COVID-19, crisis and opportunity. Journal of Industrial Relations. 63(3):291-302. doi:10.1177/00221856211012813
[46] Stewart, A., Stanford, J. & Hardy, T. (2018). The Wages Crisis in Australia: What it is and what to do about it. 10.20851/wages-crisis.
[47] Cavanough, E. (2022) Stuck in Neutral: The Policy Architecture Driving Slow Wage Growth in Australia. The McKell Institute.
[48] International Labour Organisation, (2016). Global Wage Report 2016/17: Wage inequality in the workplace.
[49] Cavanough, E. (2022)
[50] Hannam P (2022) Average Australian worker went backwards by $800 in 2021, says ACTU chief Michele O’Neil, The Guardian.
[51] Workplace Gender Equality Agency (2022) Australia’s Gender Pay Gap Statistics
[52] International Labour Organization (ILO) (2018) Global Wage Report 2018/19: What lies behind gender pay gaps
[53] See, for example: Majchrowska, Aleksandra & Strawiński, Paweł, (2018) “Impact of minimum wage increase on gender wage gap: Case of Poland,” Economic Modelling, Elsevier, vol. 70(C), pages 174-185, or M. Hallward-Driemeier, B. Rijkers, and Waxman A., 2015. “Can Minimum Wages Close the Gender Wage Gap? Evidence from Indonesia, Policy Research Working Paper 7364, World Bank Group.
[54] Eurofound (2021), ‘Minimum wage developments in the last decade, low-paid employees and minimum wage earners’, Industrial relations and social dialogue Working paper, Minimum wages in 2021: Annual review
[55] Data supplied by Professor Alison Preston, utilising Household, Income and Labour Dynamics in Australia (HILDA) data. All estimates are weighted to reflect population totals.
[56] Government of Western Australia (2022). Submission of the Government of Western Australia. Fair Work Commission 2021-22 Annual Wage Review
[57] Ibid.
[58] Charlesworth, S., and Smith M. (2018) ‘Gender Pay Equity’ in Stewart, A., Standford, J., Hardy, T. (eds) The Wages Crisis in Australia: What it is and what to do about it. DOI: https://doi.org/10.20851/wages-crisis
[59] Australian Aged Care Collaboration (2022) Priced out: Aged care wages and living costs
[60] Ibid.
[61] Australian Institute of Health and Welfare (2021) COVID-19 and the impact on young people. Australian Government.
[62] Data supplied by Professor Alison Preston, utilising Household, Income and Labour Dynamics in Australia (HILDA) data. Estimates generated by pooling waves 17, 18 and 19 (covering 2017-2019). 2020 data were not included as hourly wage data was not consistent with previous waves because of JobKeeper and other payment payments. All estimates are weighted to reflect population totals.
[63] Examples include: Oreopoulos, Philip, Till von Wachter, and Andrew Heisz. 2012. “The Short- and Long-Term Career Effects of Graduating in a Recession.” American Economic Journal: Applied Economics 4, no. 1: 1–29. https://doi.org/10.1257/app.4.1.1; Rothstein, Jesse. 2020. “The Lost Generation? Labor Market Outcomes for Post Great Recession Entrants.” National Bureau of Economic Research Working Paper no. 27516, July 2020. https://doi.org/10.3386/w27516 ; and Schwandt, Hannes, and Till von Wachter. 2018. “Unlucky Cohorts: Estimating the Long-Term Effects of Entering the Labor Market in a Recession in Large Cross-Sectional Data Sets.” National Bureau of Economic Research Working Paper no. 25141, October 2018. https://doi.org/10.3386/w25141.
[64] Ibid.
[65] Ibid.
[66] Everybody’s Home (2022) Young Australians crunched by housing crisis
[67] Birch, E. and Preston, A. (2022) The Australian labour market in 2021. Economics Discussion / Working Papers 22-02, The University of Western Australia, Department of Economics.
[68] Borland, J. and Coelli, M. (2021) Is It ‘Dog Days’ for the Young in the Australian Labour Market? The Australian Economic Review, Vol 54, 4: 421-444
[69] Sturn, S (2018) “Do Minimum Wages Lead to Job Losses – Evidence from OECD Countries on Low-Skilled and Youth Employment,” ILR Review: The Journal of Work and Policy 71, no. 3: 647-675
[70] Birch, E. and Preston, A. (2021) The Evolving Wage Structure of Young Adults in Australia: 2001 to 2019, Economic Record, Vol. 97, no. 318: 365–386
[71] Birch, E., Preston, A. (2021) “The Australian labour market in 2020”, Journal of Industrial Relations, doi:10.1177/00221856211002224
[72] Industrial Relations Act (1979)