Introduction
The Western Australian Council of Social Service (WACOSS) considers the minimum wage to be a vital means of protecting low-income workers from poverty. An adequate and appropriate minimum wage supports a decent standard of living for working people and their families. As the minimum wage ensures a fair and inclusive economy where all can contribute and thrive, it also delivers economic benefit to the wider Western Australian community. As the peak body for the community service sector in WA and an advocate for people experiencing marginalisation, disadvantage and hardship, WACOSS has a particular interest in the adequacy of living standards and quality of life experienced by Western Australians on low incomes.
WACOSS’s submission to the 2023 State Wage Case relies on the provisions in the Industrial Relations Act 1979, at Clause 50A(3)(a) for the Commission to consider in its determination of minimum rates of pay the need to:
- ensure that Western Australians have a system of fair wages and conditions of employment; and
- meet the needs of the low paid; and
- provide fair wage standards in the context of living standards generally prevailing in the community; and
- contribute to improved living standards for employees; and
- protect employees who may be unable to reach an industrial agreement; and
- encourage ongoing skills development; and
- provide equal remuneration for men and women for work of equal or comparable value.[1]
In preparing this submission, WACOSS has carefully considered the health of the wider economy and the changing economic and work environment for low-wage workers. Our submission presents a contemporary argument for raising the state minimum wage that considers the latest research, the broader body of knowledge in related areas and the lived experience of minimum wage workers in WA. Our submission aims to provide the Commission with the best available data and analysis upon which to base its deliberations.
WACOSS’s claim
WACOSS submits that an increase to the State Minimum Wage rate of 7 per cent is essential to meet the needs of the low paid and to contribute to improved living standards for employees.
Despite Western Australia’s wealth, and continued low unemployment rates, inequality in the state continues to rise. The sharp increase in cost of living, evidenced by rising CPI has placed significant financial stress on low paid workers in WA. Increased price pressures result in a real wage decline, drastically eroding workers’ purchasing and saving power. An increase in the minimum wage of 7 per cent is necessary to close the gap between declining real wages and essential living costs to maintain low paid workers living standards in line with community expectations.
As an example, housing is one of the most significant stressors for low paid households. The weekly median rent of a house now sits at $550 and the medial rent of a unit at $495.[2] These prices, respectively, reflect 67 per cent and 60 per cent of the State Minimum Wage. Such high rental prices have placed low-income families in severe housing stress and have impacted their ability to pay for other necessities such as food and electricity – which are also increasing in price.
Increased costs have caused low-income families to change their behaviour to ensure they can meet their basic needs. This includes paid workers accessing emergency relief supports, not using electricity to heat or cool their home, or skipping meals. Foodbank reports that in the last 12 months, 208,000 households went hungry due to a lack of funds, including skipping meals or going the entire day without eating.[3] Similar cost increases, and pressures, have been seen in all regions of WA.
Behavioural changes adopted by low-income workers increase inequity across a range of social determinants of health – including quality nutrition, connectedness to community, access to power and housing, and basic hygiene. Unmet needs lead to increased adverse mental and physical health outcomes, which in turn lead to increased financial pressure, and more unmet needs. Thus, the cycle of inequity is embedded.
The primary basis of WACOSS claim is that our proposed increase to the State Minimum Wage is both possible and needed to reduce the significant inequity that exists in WA and support low-income workers live a connected, safe and productive life.
State Minimum Wage workers are currently living $171 per week below the 60 per cent of median earnings poverty line and only earn 41 per cent of the WA Average Weekly Ordinary Time Earnings. In the current economic environment, we consider it to be appropriate to narrow that gap and ensure that the needs of the low paid are addressed.
Economic analysis suggests that the potential inflationary impact of raising the minimum wage in the current environment is minimal because the minimum wage is only a small proportion of aggregate wage growth.[4] As such, even a significant increase in minimum wage will have a very limited impact on inflation. The OECD also reports that the risk of price/wage spiral is significantly lower than in the past due to key structural changes in the labour market.[5]
With clear evidence of Western Australians experiencing significant living cost pressures, WACOSS considers a 7 per cent or $57.40 per week increase to the State Minimum Wage to be essential in order to meet the needs of the low paid and to contribute to improved living standards for employees.
The Cost of Living in WA
The cost of living in WA has seen a sharp increase over the past year, which has had the most impact on low-income earners. This section of the submission provides baseline analysis on the cost of living in WA and discusses how changes in the Consumer Price Index and the increasing cost of housing, food and utilities are placing increased pressure on low-wage households.
Consumer Price Index Changes
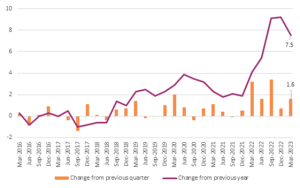
The significant and sustained price increases experienced by Western Australians has eroded the purchasing power of their wages. The Consumer Price Index (CPI) provides a key measure of price inflation for households, tracking price movements for a fixed basket of goods and services over time. The substantial price pressures that burden WA households were made apparent in the latest CPI figures released on 26 April 2023, which recorded an annual rise of 5.8 per cent for the Perth area (see Figure 1).[6]
Figure 1. Perth, All groups CPI, quarterly and annual movements (%)
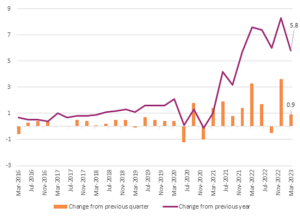
Source: ABS 6401.0
The overall CPI increase, across all domains, for Perth is reflected in price rises for workers earning the minimum wage. For instance, as demonstrated in Figure X, Rent CPI in Perth has increased both in the last quarter and the last year, leading to CPI levels much higher than experienced from 2016 until late 2021. Additionally, rents in Perth increased on an annual basis by 7.6 per cent, and from the previous quarter by 2 per cent. This increase saw Perth experiencing the highest annual change of any capital city in Australia and the second highest quarterly change.
Figure 2. Perth, Rents CPI, quarterly and annual movements (%)
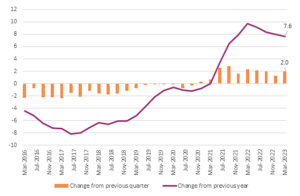
Source: ABS 6401.0
Rents CPI, quarterly and annual movements (%)
 Source: ABS 6401.0
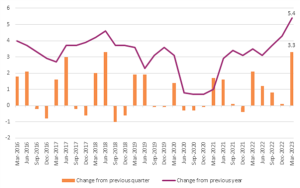
Similar rises can be seen in CPI of food and non-alcoholic beverages (see Figure 4) and health costs (see Figure 5) for people living in Perth. Food and non-alcoholic beverages experienced a significant annual percentage increase of 7.5 per cent, with a quarterly rise of 1.6. The annual rise in health costs for Perth was 5.4 per cent and a quarterly increase of 3.3.
Figure 4. Perth, Food and non-alcoholic beverages CPI, quarterly and annual movements (%)
Source: ABS 6401.0
Figure 5. Perth, Health CPI, quarterly and annual movements (%)
Source: ABS 6401.0
As a result of the increased cost of living pressures at a time of low wage growth, most Australian workers have experienced a real wage decline of 4.5 per cent, which is the largest fall on record.[7] As noted by the WA Government in their submission to the Fair Work Commission 2022/23 Annual Wage Review, the real wage decline over the past 12 months has eroded workers savings and purchasing power.[8]
In response to this there has been significant media debate over the need to increase wages against concerns that wage increases may cause inflationary pressure and lead to a wage/price spiral.[9] While inflationary concerns are valid in some economic circumstances, several studies have shown that wages have not played a significant role in Australia’s recent rise in inflation, and that pursuit of profits by large businesses throughout the pandemic are more to blame.[10],[11]
Additionally, the OECD and Australia Institute suggest that the contribution of minimum wage to aggregate wage growth is minimal and as such, even a significant increase in minimum wage will have a very limited impact on inflation.[12],[13] The OECD also reports that the risk of price/wage spiral is significantly lower than in the past due to key structural changes in the labour market.[14]
These findings have been similarly corroborated by analysis published by the Reserve Bank of Australia. This research found that ‘the overall risk in most advanced economies is probably quite low, and certainly lower than in the 1970s.[15] Consequently, in the current economic environment, an increase to minimum wage is an effective tool to protect low-paid workers from the severe financial stress associated with increased cost of living.[16]
Housing
Access to safe, secure and affordable shelter allows people to fully engage in our community. Stable tenancies are crucial to support positive outcomes in areas like health and wellbeing, education and employment. Conversely, insecurity and instability in housing creates the circumstances for increased hardship and entrenched disadvantage.
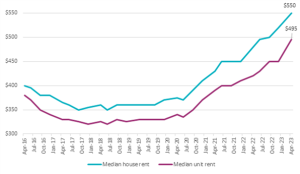
Housing is the single largest living cost for households in Western Australia, and housing costs have a disproportionate impact on those living on the lowest incomes.[17] With median rents in Perth on the increase since 2018, and drastically rising since 2020, the pressure on households due to rental costs has never been more apparent.
As of April 2023, over the past 12 months, median house rents in Perth had increased by more than 14.6 per cent, and by 27.9 per cent since April 2021 (see Figure 6). Median unit rents also saw significant increases of 17.9 per cent since 2022 and by 26.9 per cent since 2021.[18]
Figure 6. Perth median house and unit rents
Source: REIWA data
Households are in ‘housing stress’ when their housing costs exceed 30 per cent of their income, and their earnings are in the bottom 40 per cent of equivalised disposable income (minimum wage earners). Currently, the weekly median rent for a unit accounts for over 60 per cent of the State Minimum Wage, while the median rent for a house is over 67 per cent (see Figure 7). If a household earning the minimum wage is paying over 60 per cent of their income on rent for a median rental property, then they most certainly are in severe housing stress.
Figure 7. Median Rent and the State Minimum Wage
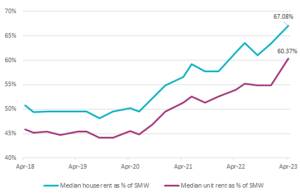
Source: Calculations based on REIWA and WA Department of Commerce data
Housing costs have a disproportionate impact on those living on the lowest incomes.[19] A recent report by Anglicare Australia and Everybody’s Home, a national coalition of housing, homelessness and welfare organisations, has revealed the impact high rents are having on essential workers. This analysis compares data on rents against the award wages for fifteen essential worker categories.
In this report, workers in hospitality, meat packing, child care and aged care were found to be spending the highest percentage of their income on rent. In Perth, all of the fifteen essential worker categories were found to have to spend in excess of 50 per cent of their income on rent, with hospitality workers and meat packers having to spend 72 per cent of their income. In Northern Western Australia, hospitality workers and meat packers would have to spend over 80 percent of their income on rent.[20]
Income on Rent, Western Australia (%)
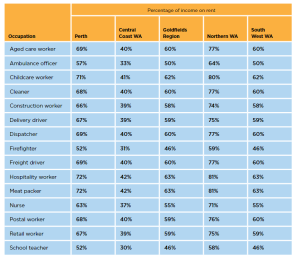
Source: Anglicare Australia and Everybody’s Home (2023)
The increased pressure rental prices are having on low income workers is also evidenced in the annual Anglicare Rental Affordability Snapshot, which took a ‘snapshot’ of the rental market on the of the 17 and 18 March 2023 and examined both whether the properties being advertised are both affordable for a range of different low-income types and whether those properties are appropriate for the composition of their household.[21] The report found a lack of affordable and appropriate properties across WA.
Only 5 properties advertised for rent in Perth were affordable and appropriate for a single worker on the minimum wage. This was a decrease from 42 properties, representing 1.4 per cent, in 2022. In the South West, the Great Southern, the Mid West and Gascoyne, 0 properties were affordable and appropriate. Only two properties per region were affordable and appropriate for a single worker on the minimum wage in the North West, the Wheatbelt and the Goldfields. The report also found that since the 2022 snapshot, median rents have increased in the Perth Metro area by 17 per cent, in the South West and Great Southern by 24 per cent and in the North West by 25 per cent.
Affordable and Appropriate Properties by Region and Household Type
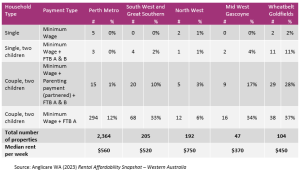
Source: Anglicare WA (2023) Rental Affordability Snapshot – Western Australia
Over the last twelve months, Perth couples living on the minimum wage and in receipt of the Parenting Payment (meaning they are caring for a child under the age of 6) saw a decrease in the availability of affordable and appropriate rental properties from 3.2 per cent to 1 per cent of those advertised. This was a decline from 7.2 per cent in 2021. A single parent on the minimum wage, supporting two children, saw a decline in affordability from 0.4 per cent to 0 per cent, with a total of only 3 properties found that would be appropriate and affordable.
A recent survey of 330 renters published in April 2023 by Make Renting Fair WA found that 58 per cent of respondents had experienced at least one rent increase in the last two years, and 14 per cent having experienced two rental increases. 33 per cent of survey respondents had a rent increase between $21 and $50 per week, 10 per cent had a rent increase between $51 and $75 per week, and 11 per cent had a rent increase between $76 and $100 per week. 57 per cent of respondents reported that they had found these increases difficult. 80 per cent of respondents reported that if their rent was to increase by a further 10 per cent over the next 12 months, that they would find such an increase difficult.[1] Increases in rent can have a dramatic impact on the ability of a low-income household to stay in a property and maintain the important connections they have established throughout their local community.
The findings of the snapshot and Make Renting Fair Survey make clear how unaffordable the rental market has become for people on the minimum wage in WA. Particularly, the very low level of accessible properties available to rent for single minimum wage earners, including single parents, strongly indicates the likelihood that many households will be living in housing stress or making do with inappropriate housing. Fewer appropriate and affordable housing choices means that low-income households are being forced onto the fringes of the metropolitan region to find housing, requiring low-income earners to live further away from jobs, schools and services, and placing a strain on their weekly travel budget. The combination of financial stress and greater travel time also has a negative impact on workplace productivity and worker resilience.
Recent analysis by the Bankwest Curtin Economic Centre found that the cost of lower quartile lower rental properties has risen even faster than the rest of the market. No sub regions in Greater Perth were deemed to be affordable for lower income households, with rental costs comprising between 33 per cent and 42 per cent of income in every metropolitan area. Regional housing markets have also observed substantial and unaffordable rental increases, with the lower quartile rent to income ratio for Broome at 45.5 per cent, Port Hedland at 44 per cent, and the Augusta – Margaret River – Busselton nexus at 44.9 per cent.
Notably too, the report found that recent percentage rises in rental costs have been as high or higher in suburbs that have been traditionally considered more affordable. Over the past 12 months, some of the highest proportional increases in rental costs were observed in Kwinana at 14.5 per cent, Gosnells at 13.7 per cent and Armadale at 15.3 per cent. [2]
Rental costs for established houses by Perth suburb and WA region: 2022
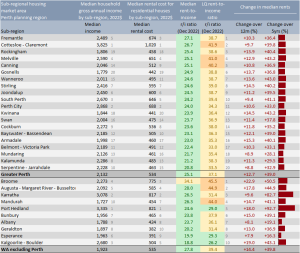
Source: Bankwest Curtin Economics Centre (2023) Housing Affordability in Western Australia.
The same also holds true for housing affordability for those lower quartile households in Western Australia with a mortgage, as the cost of purchase of lower quartile established houses has risen by on average 4 per cent, making very few Perth suburbs even moderately affordable.
Lower-quartile price-income ratios for established houses, by WA sub-region: 2022
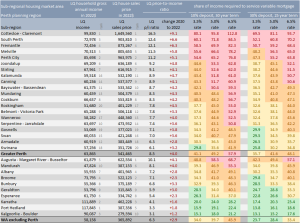
Source: Bankwest Curtin Economics Centre (2023) Housing Affordability in Western Australia.
Food
Increasing price of food, particularly of healthy food, is placing financial stress on low-income earners. From March 2022 to March 2023 the Perth Consumer Price Index for food and non-alcoholic beverages saw a 7.5 per cent increase.[3] In practice, this means consumers are spending significantly more of their pay on simply covering their grocery bill, with some lower socio-economic families spending up to 40 per cent of their income to purchase a weeks’ worth of groceries.[4]
Between 2020 and 2022, Australians have seen a 17.9 per cent increase in the cost of healthy foods, such as fruits, vegetables, legumes, healthy fats and oils, and a 12.8 per cent increase in meat and meats alternatives.[5] Unhealthy foods have also been subject to price increases, but of much less significance. To manage increased food prices in a tight fiscal environment, people living on low incomes have resorted to skipping meals, avoiding expensive items like diary or meat, and purchasing cheaper, less healthy, food options.[6],[7]
Low incomes together with competing living expenses act as compounding barriers to food security for many Western Australian households. The household food budget is often regarded as more flexible compared to other fixed household and health expenses, such as rent, utility and medical bills. As a result, a household receiving a low disposable income that experiences a sudden additional expense is more likely to lower their food budget, skip meals, or reduce nutritional quality to compensate.[8]
Foodbank reports that in the last 12 months, 208,000 households went hungry due to a lack of funds, including skipping meals or going the entire day without eating. They found that 59 per cent of food insecure households in Western Australia had someone in paid employment, with WA having the highest rate of working people accessing Foodbank in the nation.[9] In April, Foodbank reported to WACOSS that they had assisted 1,044 households since the beginning of the year, which was an increase of 150 per cent from 2021.
Energy and Water
The cost of energy disproportionately impacts households on the lowest incomes, as they spend a significantly higher percentage of their disposable income on energy bills and have little, if any, capacity to absorb additional costs. People on the lowest incomes spend on average 6.4 per cent of their income on energy, compared to households in the highest income quintile, who pay on average only 1.5 per cent. Further, 25 per cent of the lowest income quintile are spending over 8.8 per cent of their income on energy. [10]
The 2022 Understanding Utility Hardship report by WACOSS and Bankwest Curtin Economics Centre provides rich insights into the causes and experiences of utility and financial hardship for Western Australians.[11] The report, which utilised a mixed methods approach, including quantitative survey data from 470 Water Corporation customers. It found income to be the largest contributing factor to utility hardship, with the lower the income, the higher the probability of being unable to pay water or electricity bills. The two greatest contributors to a household’s inability to pay for bills were having an annual household income under $40,000 and having an annual household income between $40,000 and $80,000. A worker receiving the full time minimum weekly pay rate would have had an approximate annual income of $42,634.80 over the 2022/23 financial year.
Figure 8. Contributors to households’ inability to pay for bills, household characteristics
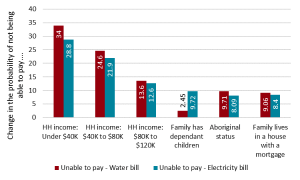
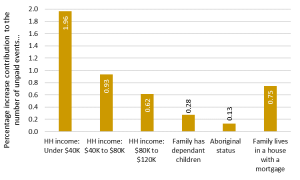
Source: Bankwest Curtin Economics Centre | Water Corporation Customer Survey.
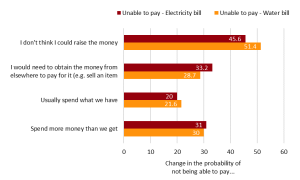
In addition to income, the report identified several other factors that are predictors of utility hardship. Firstly, households that spend more money than they receive are 30 per cent more likely to be in financial hardship than households that can save money regularly. Households that are not able to raise $4,000 in a week for an emergency are on average 50 per cent more likely to be unable to pay their electricity or water bills than households that could access this money from their savings. This effect is smaller, albeit quite significant, for people that would obtain the money by other means such as loans from friends and family or by selling items.
“Inability to pay bills. It is very difficult at my age to realise that I cannot afford to live.”
– Understanding Utility Hardship Survey Respondent
Secondly, there is a significant correlation between defaulting on different bill payments. Not being able to pay for electricity is the best predictor of people’s ability to pay their water bills (54.4 per cent). This is also true for electricity, where the best predictor is not paying for water and gas (55.3 per cent and 25.6 per cent, respectively). Unable to pay mortgage repayments remains a strong predictor, at 20.7 per cent.
Figure 9. Contributors to household’s inability to pay for bills, savings and financial management
Source: Bankwest Curtin Economics Centre | Water Corporation Customer Survey.
Figure 10. Contributors to household’s inability to pay for bills, co-dependency with other bills
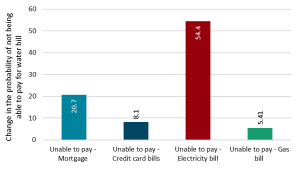
Source: Bankwest Curtin Economics Centre | Water Corporation Customer Survey.
Respondents who were unable to pay their utility bills within the last year indicated that they utilise a range of different strategies in order to cope financially. Reducing spending on food and groceries was the most common strategy, regardless of the type of utility bill, with 76 per cent of those who were unable to pay their electricity bills and water bills, and 79 per cent of those unable to pay gas bills indicating that this was a strategy they would likely use (see Figure 11). This was closely followed by reducing spending on leisure activities and reducing their consumption of water, electricity or gas.
Figure 11. Coping mechanisms by type of utility bill unable to be paid, %
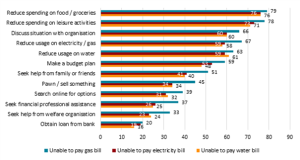
Source: Bankwest Curtin Economics Centre | Water Corporation Customer Survey.
The disproportionate impact of utility bills on low-income households can lead to mounting unpaid bills and a greater risk of disconnection, which in turn can have a significant impact on people’s wellbeing. Reported impacts include feelings of shame at being unable to provide for the family along with personal and relationship stress arising from difficult decisions about spending priorities.
“I had to make arrangements so that my kids could still have what they needed.”
– Understanding Utility Hardship Survey Respondent
Disconnections can have a range of detrimental impacts on households already struggling with everyday living costs. They can include the loss of food, an inability to bathe or to heat or cool rooms, or to maintain connection with relatives and the wider world. These impacts can lead to health problems, anxiety and emotional disorders increasing health system costs and reducing productivity. Energy debts can also affect a workers’ ability to access affordable credit in future.
“I was 1 week from being homeless. Had to call accounts and beg for time to pay. I had one income to support two people, myself and my son, now he’s moved out leaving me with all debts. I go without meals to make sure all the bills are paid on time and ahead if I can. I work two jobs to try and get ahead, but feel so tired trying to keep up.”
– Understanding Utility Hardship Survey Respondent
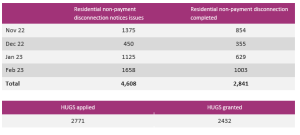
The Economic Regulation Authority WA has noted that disconnection data is a ‘valuable indicator of how affordable energy is to customers.’[12] Figures on household disconnections and Hardship Utility Grant application (HUGS) data were reported in the Western Australian Legislative Council on 29 March 2023. Though these figures fluctuate due to seasonal variations and the typical hold on disconnections over the Christmas period, they clearly demonstrate the scale of disconnections and the growing need for assistance in the community.
Synergy Disconnections between 1 November 2022 to 28 February 2023
Horizon Power Disconnections between 1 November 2022 to 28 February 2023
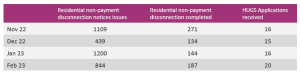
Source: WA Parliament Hansard
For most households experiencing utility billing hardship, utility bills are unlikely to be their largest cost burden, unless they have accumulated significant utility debt and debt recovery costs. Housing, followed by food and beverages, are consistently the most significant costs facing households on a day-to-day basis.[13] As such, low-income households prioritise these costs, due to their size and critical importance. This means that when housing and food costs increase, or their income is reduced, spending in other budget categories may be reduced. Where those costs are difficult or impossible to avoid, such as utilities, households may be forced to skip payments. This could be recognised as a form of ‘displaced’ hardship, where the problem is made visible by a household being unable to cover the costs of their utility bill, but is driven by increased costs elsewhere, such as housing.
The WACOSS Cost of Living Report
The annual WACOSS Cost of Living Report models five low-income household types and examines the adequacy of their income to afford a basic standard of living in line with agreed community standards. The 2022 Cost of Living Report reinforces the previously discussed findings and shows substantial growth in household expenditure, particularly for rental and transport costs, as well as significantly increased financial pressure on the model households. [14]
Living costs were found to have increased in every expenditure category, while the cessation of the Coronavirus Supplement and Economic Support Payments resulted in the income of the model households seeing little growth or declining. The gap between income and expenditure narrowed for each of the model households.
Weekly income and expenditure of our model households
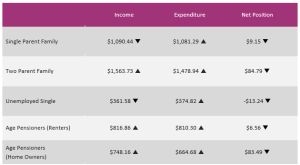
Note: All estimates of cost and consumption are intentionally conservative and, as a result, likely understate the cost impacts on households in hardship. The arrows indicate growth or reduction in values from the previous financial year.
Weekly expenditure for the single parent family rose by $97.96 per week (9.96 per cent), with an increase seen in each of the expenditure categories. Rental costs have continued to climb, with the single parent family paying an extra $31.88 per week (an increase of 9.93 per cent). After housing costs, transport had the largest dollar increase at $31.20 per week (20.45 per cent). The model two parent family’s weekly expenditure on basic living costs increased by 8.83 per cent or $120 per week over the last 12 months. As with the single parent family, this was predominantly the result of the substantial rise in the model household’s weekly rental and transport costs.
Costs in the Regions
When considering the adequacy of the State Minimum Wage it is important that differences in the cost of living for regional workers are considered. is of particular importance for award-free employees, who do not benefit from location allowance requirements set out in many private sector awards. Cost of living pressures in some regional areas, particularly the Pilbara and Kimberley, is significantly increased compared to the Perth metro area.
For instance, in the Pilbara, a two-parent family will pay on average $631.34 per week for rent, compared to the $382.50 paid by a two-parent family in Perth metro. The Pilbara is also the most expensive region for the single parent and age pensioner model households, spending $70.76 more each week than their equivalents in Perth. Median rents increased across every region in 2021/22. Particularly substantial increases occurred in the Mid West, with rental costs for the single parent and age pensioner growing by 22.84 per cent and by 43.27 per cent for the working family and unemployed single.
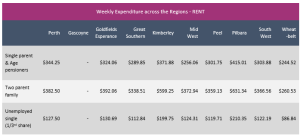
Source: Calculations based on REIWA market data
The cost of food and beverages are also variable compared to Perth. Food is the highest in the Kimberley, followed by the Pilbara. Food prices in Peel, Gascoyne, the Wheatbelt, the Southwest and Great Southern regions are all comparable to Perth metropolitan prices. Food prices in the Mid West and Goldfields/Esperance are also noticeably higher than Perth.
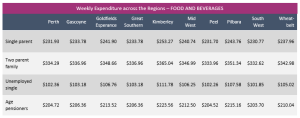
Source: Calculations based on ABS 2015/16 HES, 2022 CPI and 2021 RPI data
All model households are paying substantially more for electricity in the Pilbara and the Kimberley than those in the Southwest Interconnected System (Perth, Peel, Southwest and Great Southern). The electricity expenditure of model Goldfields/Esperance and Gascoyne/Mid West households is noticeably lower.
As the Uniform Tariff Policy means that Horizon Power customers are charged for electricity at the same rate as Synergy customers, these divergences are the result of different levels of energy consumption. Climatic conditions outside of the SWIS have a significant impact on the amount of energy required to maintain temperatures in homes at a liveable and comfortable level. The high level of energy consumption and the resultant size of the bills, combined with their seasonal and intermittent nature, mean that low-income households in regional areas can be at substantial risk of bill shock, with the likelihood of falling into utility debt even higher during the peak summer period.
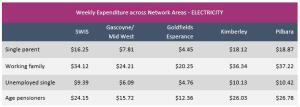
Source: Calculations based on usage data supplied by Horizon Power
There is also difference between water prices in the regions and metropolitan Perth (see Figure X). Households in the Great Southern Region are on average spending the least on water, followed by Perth, and those in the Peel and Wheatbelt regions. Tariff cap policies mean that up to the first 300kL in ‘country south’ and 500kL in ‘country north’, residential water consumption charges are no more than metropolitan charges, after which the charges reflect the cost of providing services in the different country schemes. The lower water expenditure in those regions is thus a direct result of lower consumption.
Pilbara households are spending the most on water across all model household types. For example, our working family are paying on average an extra $7.60 per week. The Pilbara is followed closely by the Kimberley, which would indicate that the climatic conditions in those regions result in a much higher level of water consumption by households.
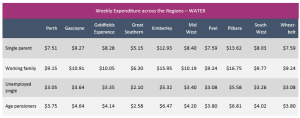
Source: Calculations based on average regional residential usage data supplied by the Water Corporation
Emergency Relief and Financial Counselling Data
Increased living costs and decline in real wages has led to more people reaching out for emergency relief and financial support. This section of the submission highlights how the high-pressure economic environment is leading to increased demand for assistance, including emergency relief and financial counselling.
Emergency Relief Providers
WACOSS operates a free online directory of community service providers for people looking for emergency relief and assistance, called WAConnect. The directory allows us to track real time search results of emergency and community relief providers, including food relief, financial counsellors, emergency accommodation and other services as well as searches by individuals in hardship seeking assistance.[15]
From 1 January 2023 to 31 March 2023, the portal registered a total of 24,600 visits from 16,800 users, generating 93,400 searches for services. When comparing these statistics to the numbers registered during the same period last year (2022), the number of users has increased by 24.95 per cent, the number of visits to the site by 31 per cent, and the number of searches for services within the portal increased by almost 8 per cent (equivalent to ~ 6500 more searches for services).
The most searched for services in the period from 1 January 2023 to 31 March 2023 included help with food (~ 27,700 searches); help with money, including overdue bills assistance, financial debt and debt services, rent assistance and more (~6,500 searches); help with accommodation (~ 2,700 searches); and help with fuel and related expenses (~1,000 searches).
The Financial Wellbeing Collective’s Emergency Relief and Food Access Service (ERFAS) reports that emergency food relief needs in Western Australia have also been steadily increasing over the past 12 months. In March 2023, the Service received 3,469 calls – an increase of 52 per cent from March 2022. There was a 28 per cent increase in clients supported between February and March, and a notable 43 per cent increase in employed clients seeking assistance compared to the previous month.
Figure 12. Emergency Relief and Food Access Service Dashboard March 2023 – Types of Assistance Provided
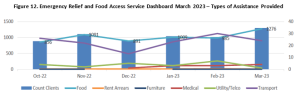
Source: Financial Wellbeing Collective, Emergency Relief and Food Access Service
Financial Counselling
Financial counselling is a free and independent service to assist people who are experiencing financial difficulty. A qualified financial counsellor provides expert advice on how to tackle their financial challenges.
Interviews with financial counsellors conducted by WACOSS for the Understanding Utility Hardship Report, identified that people are most likely to access a financial counsellor if they experience entrenched disadvantage due to persistent low incomes, low-wages, an adverse life event, or people with multiple large loans. Datasets held by the Financial Counselling Network (FNC) corroborated this, with the two main reasons that people access FCN services are when people are managing on a low or inadequate income or are having private debt issues.
Figure 13. Reasons for accessing FCN services
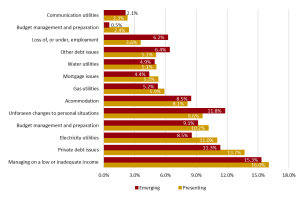
Source: Bankwest Curtin Economics Centre | Financial Counselling Network data 2022.
Note: ‘Presenting’ reasons are those that the client presented with or disclosed during the initial intake into the service, while ‘emerging’ reasons are those that emerged during subsequent meetings or assessments by the financial counsellor.
The largest percentage, more than a fourth, of FCN clients were found to have paid employment income or income from a business (see Figure 14). This highlights the financial pressure experienced by low wage earns, despite their active participating in the workforce.
Figure 14. Main source of income, FCN
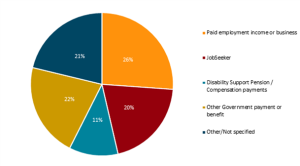
Source: Bankwest Curtin Economics Centre | Financial Counselling Network data 2022.
Income is a key indicator of financial hardship. When compared to the Water Corporation Customer Survey sample of people at risk of or in financial hardship discussed previously, the proportion of very low-income households accessing FCN’s services is higher. This is to be expected as the FCN works with people when they are experiencing financial stress.
Figure 15. Household income, FCN and Water Corporation
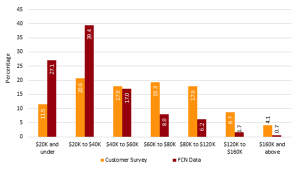
Source: Bankwest Curtin Economics Centre | Financial Counselling Network data 2022.
35 per cent of FCN clients are private renters, followed by owners with a mortgage, at 28 per cent, and renters from the housing authority at 13 per cent. These findings demonstrate that people living in rental housing are at higher risk of financial hardship, making up almost half of the households seeking help from the FCN.
Figure 16. Home ownership type, FCN
Source: Bankwest Curtin Economics Centre | Financial Counselling Network data 2022.
To assist clients with money management, budgeting and prioritising financial goals, the FCN collects data on selected expenditure patterns of families in family hardship. Clients’ average fortnightly income is $2,024, which varies according to household suburb. It can be as low as $980 per month for families living in Belmont and as high as $3,300 for Joondalup and Success; this is not the average suburb income but the average income of FCN clients from those suburbs.
For FNC clients, housing costs represent just over a third of the overall household’s expenditures (32 per cent). As discussed, increasing rental prices put significant stress on low-income households. This is evidenced by the fact almost half of households seeking support from FCN are renters (see Figure 16).
Debt repayments represent an enormous 43 per cent of household’s expenditure for FNC clients, at $807 per fortnight. This is $200 more per fortnight than what they pay for their housing, which is usually a household’s highest expenditure item. Utility costs are also significant, comprising 7 per cent of household expenses and represent on average a $130 expenditure per fortnight.
When all basic fortnightly expenses are added, the total comes to $1,865.10, leaving just $158.90 per fortnight from the average income for other costs, such as education, recreation, clothing, or emergency situations. The suburbs where households have the higher deficits in expenditure relative to income are Gosnells, Osborne Park, Coolbellup and Yanchep.
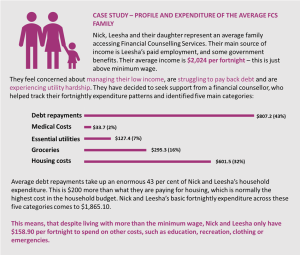
Source: Case study developed from Bankwest Curtin Economics Centre | Financial Counselling Network data 2022.
Poverty and Inequality
The experience of poverty greatly exacerbates peoples’ experiences of other types of inequalities. This section of the submission discusses the relationship between poverty and financial stress, income and wage inequality and gender equity.
Poverty and Financial Stress
The Fair Work Commission’s Expert Panel stated in its 2019-20 Decision that
Consistent with previous Review decisions, we accept that if the low paid live in poverty then their needs are not being met. In measuring poverty we continue to rely on poverty lines based on a threshold of 60 per cent of median equivalised household disposable income and that those in fulltime employment can reasonably expect to earn wages above a harsher measure of poverty.[16]
Recent poverty analysis identifies who is living in poverty in Australia, and what impact poverty has on household sentiments and behaviours. The latest report from the Poverty & Inequality Partnership[17] uses data from the Australian Bureau of Statistics to identify cohorts of society most likely to experience poverty. The report found that on average one in eight Australians, including one in six children, lived below the poverty line. Additionally, the report indicated people are more likely to experience poverty if they:
- rely on income supports such as JobSeeker, Parenting Payments, Disability Support, Youth Allowance or Carer Payments;
- are part of a households whose main income-earner is of working age but is unemployed or not in the labour force;
- are tenants in public housing or people who rented privately;
- are in sole parent households;
- are single people without children; or
- are people with disability.
For people who are in one, or more than one of these cohorts, the poverty line ranged from $489 per week for a single person to $1,027 per week for a couple with two children. While low- and no-income earners are overrepresented in the identified groups, poverty for these households can be eliminated by lifting the lowest income levels to at least half the median level of disposable income. This is evidenced by the Coronavirus Supplements, which increased the amount of money paid to low-income earners throughout the pandemic. During the periods Coronavirus Supplements were provided poverty declined significantly for all age groups, except older Australians. The financial safety net offered by the payments allowed poverty to fall by 3.8 per cent for young people, and poverty to fall by 2.3 per cent for those of working age. Once the supplements were ceased, poverty levels increased above pre-pandemic levels.[18]
Relatively high levels of poverty, coupled with increased cost pressures, are causing high levels of financial stress and financial hardship for low-income earners. The NAB Australian Wellbeing Survey indicates the substantially higher rate of financial stress for low income earners (see Figure 17) and the growth of financial stress across Western Australia (see Figure 18). [19]
Figure 17. NAB Financial Stress Index: Lower/Higher Income, Q1, 2023
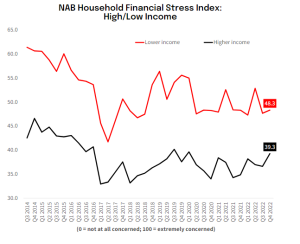
Figure 18. NAB Financial Stress Index: WA, Q1, 2023
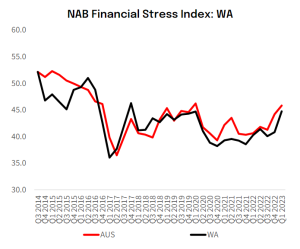
Source: NAB Behavioural and Industry Economics (2023)
Such an increased financial hardship is changing the behaviour of low-income earners as they prioritise trying to meet bills for necessary items. For example, the most recent report in the Taking the Pulse of the Nation[20] report series suggests that low-income earners are struggling to meet the cost of their daily energy needs. One in five people included in this survey cannot afford to heat or cool their homes to a comfortable level, with young adults and those earning less than $50,000 per annum most at risk of being unable to control the temperature of their living environment.
The number of people unable to afford to heat or cool their homes is almost four times as high when the data only of those in financial stress is considered. Half of the people experiencing financial stress are taking all possible measures to reduce energy costs and 12 per cent of those in financial stress report skipping meals to help meet climbing energy bills. Evidently, the financial pressure resulting from the combination of increased costs and low incomes have significant impacts beyond financial security. For low-income earners, financial pressure works to disrupt the foundational elements of health and wellbeing, such as access to safe and appropriate housing and quality nutrition. Applying the social determinants of health model, it is evident that limited access to the foundational elements of health creates significant and long-term inequity – including poorer long-term health outcomes and lower life expectancy.
Income Inequality and Wages
Income inequality has a significant negative impact on society, both socially and economically, being linked to not only the undermining of community cohesiveness, but also to having a statistically significant adverse effect on economic growth. [21]
The Gini coefficient, a measure of income distribution across a population, in the most recent ABS Survey of Income and Housing data shows that Western Australia has the highest rate of income inequality in Australia. The Gini coefficient ranges between 0 and 1, with 0 corresponding to perfect income equality and 1 corresponding to perfect income inequality. In the aforementioned ABS Survey Western Australia had a Gini coefficient of 0.331, which was the most unequal distribution of income across Australia and when compared to the nation as a whole.
Gini Coefficient 2019-20 (National, States and Territories) [22]
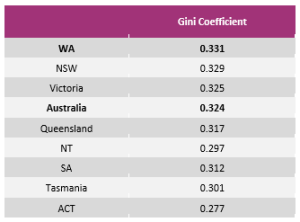 Source: ABS 6523.0
One factor contributing to inequitable wage distribution in Western Australia is the growth in the gap between the state minimum wage rates and median pay levels. As of November 2022, the State Minimum Wage was only 41 per cent of the WA Average Weekly Ordinary Time Earnings (AWOTE). In comparison, the National Minimum Wage comprises 44.95 per cent of Australia-wide seasonally adjusted average weekly earnings as of November 2022. In November 2005, the State Minimum Wage was 47.6 per cent of the WA AWOTE (see Figure 19).
Figure 19. WA AWOTE, Median Earnings and State Minimum Wage
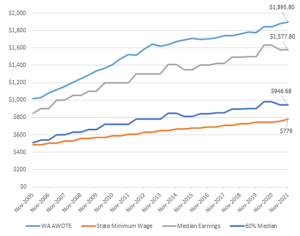
Source: ABS 6302.0, 6333.0, and WA Department of Commerce
While the gap between the State Minimum Wage and the relative poverty threshold of 60 per cent of median earnings has contracted slightly following the 2022 State Wage Case decision, that gap remains significant with further progress needed to narrow that gap and address the needs of the low paid. The State Minimum Wage is currently $171 per week below the 60 per cent of median earnings poverty line for November 2022.
Low wage growth has, for several years, been identified as a serious problem for the Australian economy.[23] A continued extended period of stagnating wage growth will likely bring a range of negative material and social outcomes for Western Australian households. The International Labour Organisation’s ongoing analysis of global wage trends has identified the social and economic consequences of stagnating average wages:
On the social side, the disconnect between economic growth and wage growth means that workers and their families do not feel that they are receiving a just share of the fruits of economic progress, which fuels their frustration. On the economic side, low wage growth dampens household consumption, which can reduce aggregate demand, particularly when wages stagnate in many large economies at the same time.[24]
Economic experts have warned of the significant economic and social consequences of wage stagnation, including undermining household financial stability, consumer spending, further productivity growth and government revenues, as well as resulting in a shift in income distribution away from labour and towards capital.[25]
While many low-wage earners are living below the poverty line a small handful of Australians hold the majority of Australia’s household wealth. Analysis by the World Inequality Lab found that in 2021 the wealthiest 10 per cent of Australians owned 56 per cent of total household wealth. In comparison, the share of total household wealth owned by those in the bottom 50 per cent of wealth in Australia held just 5 per cent (see Figure 20).[26]
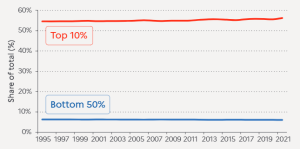
Source: World Inequality Lab, 2022
Additionally, Oxfam has calculated that over the past two year, the wealth of Australia’s 47 billionaires doubled to $255 billion at a rate of more than $205 million a day. These 47 billionaires hold more wealth than the poorest 30 per cent of Australians, equating to 7.7 million people.[27]
Gender Wage Gap
The WA labour market continues to be characterised by a significant gender pay gap. ABS data indicates that as of November 2022, WA currently supports the biggest difference in overall pay between men and women by a significant margin across all jursidictions, with a gender pay gap of 22.1 per cent .[28] Using the Workplace Gender Equality Agency’s datasets based on reporting by private businesses, WGEA and the Bankwest Curtin Economics Centre calculate that the gender pay gap in Western Australia is 26.8 per cent for base pay and 32.1 per cent when including bonuses, overtime and other discretionary pay.[29]
The WA gender pay gap has many contributing factors. Much of the gap is borne out of a gendered concentration of staff in high paying industries within the state, rather than salary differences between women and men in the same industry. In WA, women make up a significant proportion of the workforce in lower paying industries. These are also known as feminised industries and include sectors such as childcare, aged care, health care, retail trade, accommodation and food services. For example, in WA women make up only 19 per cent of the mining workforce but comprise 83 per cent of the health care and social assistance workforce. Workers in feminised industries are often completely reward reliant. This means in WA, women are more reliant on minimum wage.[30]
While WA’s gender wage gap can be lessened by increasing the proportion of women in higher paying industries and the proportion of men in lower paying industries, Duncan et al (2022) suggests that this will only decrease the gender pay gap by a third. Closing the gender pay gap also requires substantial work to minimise salary differences between low and high paying industries. This can be achieved by raising the minimum wage, and remunerating people in feminised industries in a way that better reflects their value to society.[31],[32] The Fair Work Commissions recent decision to award age care workers a 15 per cent rise is an important step forward in valuing the work of women[33].
The WA gender pay gap represents just a fraction of the real cost burden on women, and the inequity experienced. Due to their reliance on lower wages, women are disproportionately adversely affected by increased costs of living.[34] As of November 2022, women’s average full-time earnings across all industries in WA were $478.10 less each week than their male counterparts.[35] This means over a year, on average, WA women have $24,861.20 less to cover the sharp increase in the cost of necessities including groceries, energy, and housing. Difference in pay is exacerbated in feminised sectors, where weekly pay may not even cover the cost of expenses.
Increase cost pressures also have significant ramifications for women’s long-term economic security, with women under financial pressure less likely to make additional superannuation contributions, pay off debt or save.[36] The 2022 National Australia Bank Australian Wellbeing Survey reinforces this phenomenon finding that women are reporting much higher levels of financial stress than men, particularly when it comes to medical bills, household items and raising $2000 in emergency funds.[37] The financial pressure placed on women also negatively impacts their health and mental health. HILDA data suggests that women, on average, have mental health scores four per cent lower than males, and financially constrained women have scores seven and a half per cent lower than women who are not financially constrained.[38]
WACOSS submits that an increase of 7 per cent to the State Minimum Wage is an important lever to help address the gender pay gap across all industry sectors, particularly in low paid, female-dominated sectors. It may also help redress labour shortages in the community services sector, while ensuring workers are fairly paid and well-supported to provide quality care to Western Australia’s most vulnerable community members.
Conclusion
It is the view of WACOSS that in order to “ensure that Western Australians have a fair system of wages and conditions; meet the needs of the low paid; provide fair wage standards in the context of living standards generally prevailing in the community; and contribute to improved living standards for employees”[39] the State Minimum Wage needs to be raised by 7 per cent.
WACOSS considers that increasing the State Minimum Wage to any amount lesser than our request will not be sufficient to alleviate the financial burden currently experienced by low-income earners. Rapid, and sharp, increases in the cost-of-living mean low-income earners currently do not have sufficient funds to meet the rising cost of rent, food and electricity.
For State Minimum Wage earners, who currently live below the poverty line by $171 per week, this pressure manifests into behaviour changes such as skipping meals or not heating or cooling their homes. These behavioural changes increase inequity across a range of social determinants of health and create a negative and self-reinforcing relationship between increasing needs and increasing financial pressure. Thus, the cycle of inequality is embedded.
Increasing the State Minimum Wage is an effective strategy to help break this cycle. Increased wages not only mean low-income earners have enough money to cover living costs but that they have the financial resources and mental capacity to live a productive and connected life and be active members of our community.
WACOSS’s claim of a 7 per cent increase to the State Minimum Wage will deliver an undeniable benefit to many of the lowest-paid workers, and their families. A strong minimum wage — one which ensures workers are provided with a decent living standard, well above poverty levels is integral for an inclusive and sustainable economy, where the benefits are shared with all Western Australians.
For further enquiries on this submission please contact:
Graham Hansen
Senior Policy Officer
[email protected]
08 6381 5300
Endnotes
[1] ‘New survey data shows full impact of unlimited rent increases’, Make Renting Fair WA (Web Page, 2023)
[2] Ryan Brierty et al, Housing Affordability in Western Australia 2023: Building for the future (Bankwest Curtin Economic Centre Focus on WA Report Series, No 17, May 2023).
[3] ABS (n 6).
[4] Cait Kelly, ‘Rising food prices hit every supermarket aisle putting pressure on low-income families’, The Guardian Australia (Web Page, 2022).
[5] Merron Lewis et al, ‘Healthy food prices increased more than the process of unhealthy options during the COVID-19 pandemic and the concurrent challenges to the food system’ (2023) 20(4) International Journal of Environmental Research and Public Health 3146.
[6] Shannon Schubert, ‘Rising food costs cause people to skip meals, avoid diary, alcohol, meat to cope financially’, ABC News (Web Page, 2023).
[7] Lewis (n 25).
[8] Sue Booth and Alison Smith, ‘Food security and poverty in Australia — challenges for dietitians’ (2001) 58(3) Australian Journal of Nutrition & Dietetics 150.
[9] Foodbank (n 3).
[10] ACOSS and the Brotherhood of St Laurence, Energy Stressed in Australia (Report, 2018).
[11] Graham Hansen, Eva Perroni and Dr Silvia Salazar, Understanding Utility Hardship, Western Australian Council of Social Service and Bankwest Curtin Economics Centre (Report, 2022).
[12] Economic Regulation Authority (2020) Annual Data Report – Energy Retailers 2018/19
[13] Graham Hansen, Cost of Living Report 2022, Western Australian Council of Social Service (Report, 2022).
[14] Ibid.
[15] WAConnect (Web Page, 2023).
[16] Annual Wage Review [2020] FWCFB 3500, 85.
[17] Peter Davidson, Bruce Bradbury and Melissa Wong, Poverty in Australia 2023: Who is affected (Poverty and Inequality Partnership Report no. 20, March 2023).
[18] Peter Davidson, A tale of two pandemics: COVID, inequality and poverty in 2020 and 2021 (Build Back Fairer Series, Report No. 3, March 2022).
[19] National Australia Bank Group Economics, NAB Australian Wellbeing Survey: Q1-2023 (Report, 2023).
[20] Kushnell Prakash, ‘Taking the pulse of the nation (2023) – surveys Australian population to capture sentiments and behaviours,’ Melbourne Institute Applied Economic and Social Research (Web Page, 2023).
[21] OECD ‘The Impact of Income Inequality on Economic Growth’, In It Together: Why Less Inequality Benefits All (Report, 21 May 2015).
[22] Australian Bureau of Statistics, Household Income and Wealth, Australia (Catalogue No 6523.0, 28 April 2022).
[23] Stephen Clibborn, ‘Australian industrial relations in 2020: COVID-19, crisis and opportunity’ (2021) 63(3) Journal of Industrial Relations 291-302.
[24] International Labour Organisation, Global Wage Report 2016/17: Wage inequality in the workplace (Report, 2016).
[25] Andrew Stewart, Jim Stanford and Tess Hardy, The Wages Crisis Revisited, Centre for Future Work (Report, 2021).
[26] World Inequality Lab, ‘Australia’, World Inequality Database (Web Page, 2022).
[27] Oxfam Australia, ‘Australia’s billionaires double fortunes during pandemic as global inequality grows’, Oxfam Australia Media Releases (Web Page, 2022).
[28] Australian Bureau of Statistics, Average Weekly Earnings Australia, November 2022 (Catalogue No 63020, 23 February 2023).
[29] Alan Duncan, Astghik Mavisakalyan and Silvia Salazar, Gender Equity Insights 2022: The State of Inequality in Australia (WGEA Gender Equity Series Issue 7, October 2022).
[30] Ibid.
[31] Ibid.
[32] Justice Ross, Occupational segregation and undervaluation (Fair Work Commission President’s Statement, 4 November 2022).
[33] ‘15% wage increase for aged care sector’, Fair Work Ombudsman (Web Page, 24 March 2023).
[34] ‘National gender pay gap of 13.3% just a fraction of the real cost on women’, Workplace Gender Equality Agency (Web Page, 23 February 2023).
[35] ABS (n 49).
[36] Alison Preston, Submission 58 to the Senate Select Committee, Cost of Living (12 May 2023).
[37] National Australia Bank Group Economics, NAB Australian Wellbeing Survey: Q4-20232 (Report, 2022).
[38] Preston (n 56).
[39] Industrial Relations Act 1979 (WA) cl 50A(3)(a).